Graph Measurements on a Site
Time series data for a site can be graphed multiple ways. One way is by viewing the predefined default report from the site details panel. The default report is determined by the type of monitoring site.
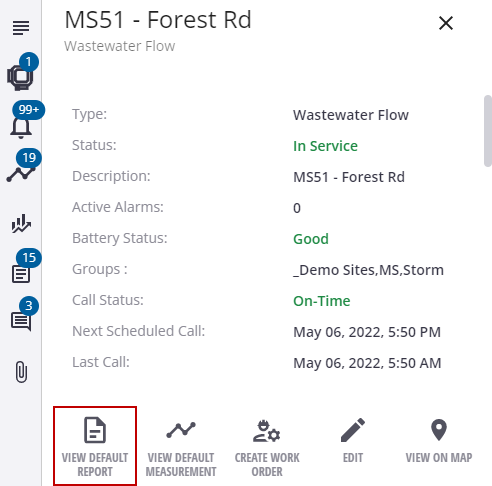
- Select a site from the site list or on the map.
- Click View Default Report.
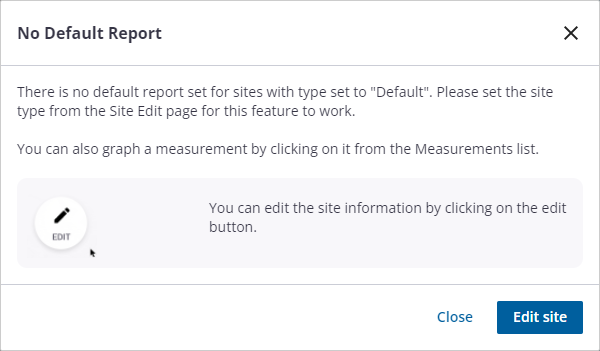
The default report data for the site populates. Please note if you get the following message indicating that there is no default report set for the site, either change the site type by editing the site details, or graph the measurements by selecting them from the Measurements section.
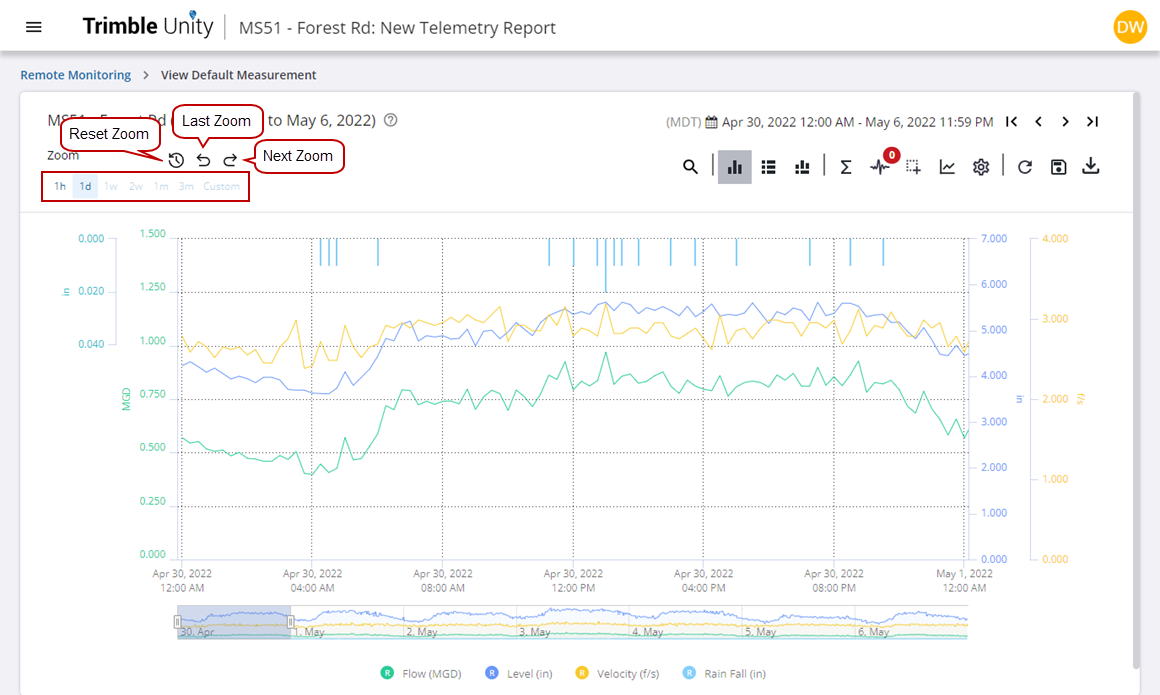
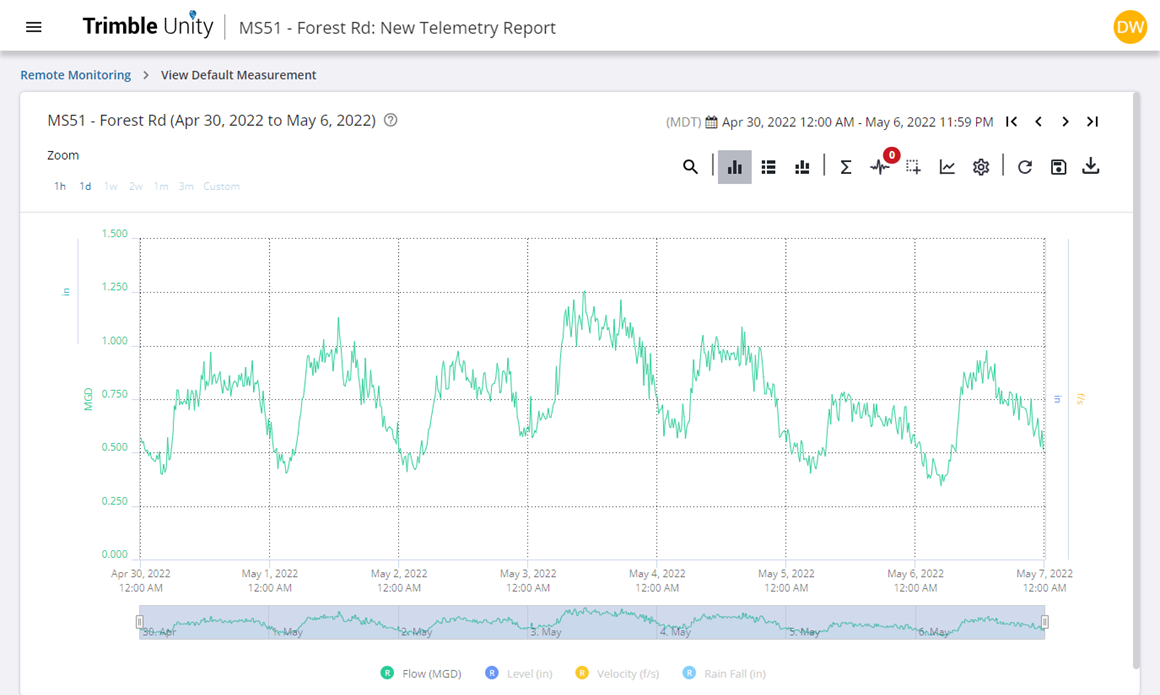
- Hover your mouse over the graph to view data for that point in time.
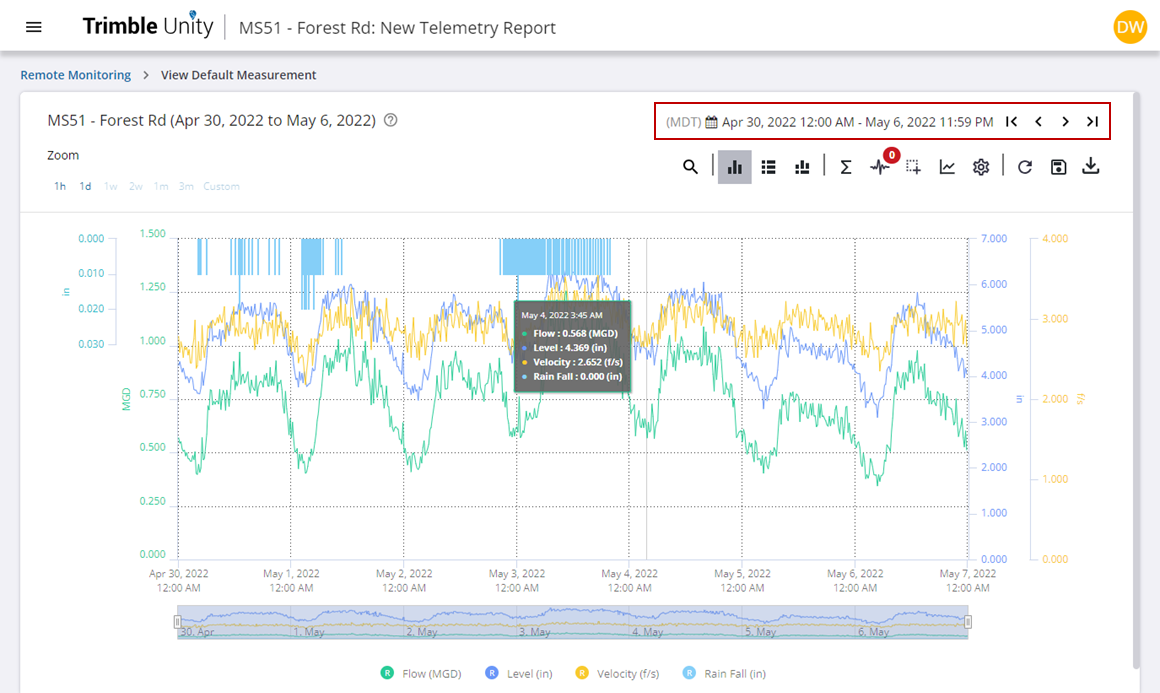
- Update the date range manually by clicking the dates and entering the date and time values. The first date selected corresponds to the report start time and the second date selected corresponds to the report end time.
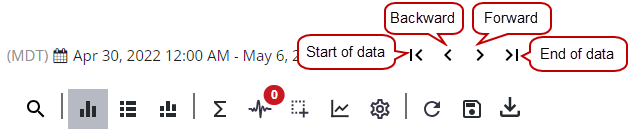
- You can also update the date range by clicking the Backward or Forward arrows in the upper-right corner to view the previous or next time period of data. Click the start of data arrow to go back in time to the first instance of collected data or the end of data arrow to go to the most recent instance of collected data.
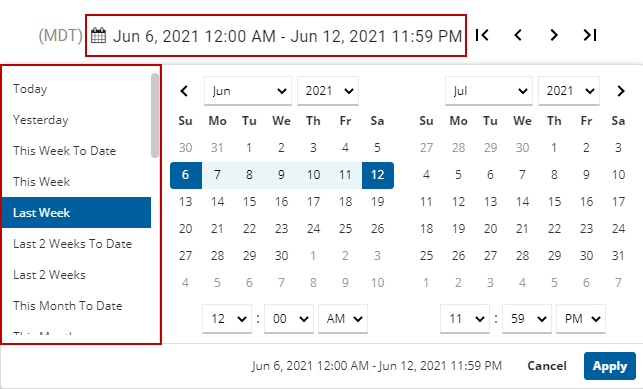
- To select from a predefined list of reporting periods, click inside the date range and then select the predefined reporting period on the left side of the panel that opens. A custom date range can be selected by clicking the dates in the calendar display.
- Click and drag your mouse over the graph to draw a box around the data to zoom to the measurement.
- Click the default zoom ranges above the graph to zoom to 1 hours, 1 day, 1 week, 2 weeks, 1 month, or 3 month time windows. Note that the report will only enable the options that are within the reporting date and time period.
- Click Reset Zoom to reset the graph measurements, Last Zoom to return to the previous measurement zoom, or Next Zoom to return to the new measurement zoom.
- Click a measurement or site name in the legend at the bottom of the graph to quickly show or hide the data for the measurement/site on the graph. This may be helpful if you are viewing multiple measurements/sites at a time and only want to view data for one measurement/site.
Another way to graph time series data is from the default measurement report on the site details panel. The default measurement is determined by the type of monitoring site.
- Select a site from the site list or on the map.
- Click View Default Measurement.
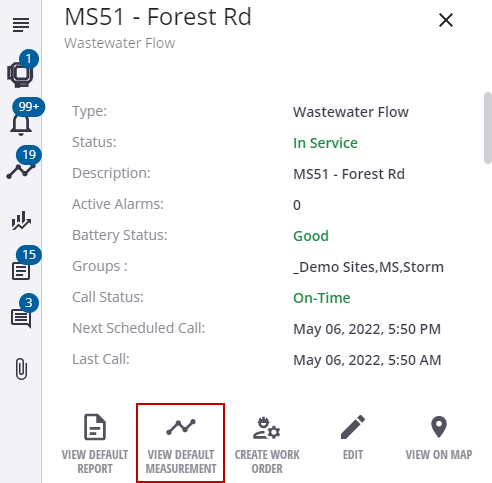
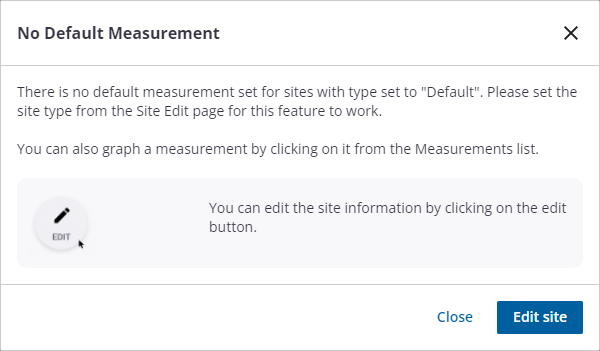
The telemetry report populates with the default measurement. Please note if you get the following message indicating that there is no default measurement set for the site, either change the site type by editing the site details, or graph the measurements by selecting them from the Measurements section.
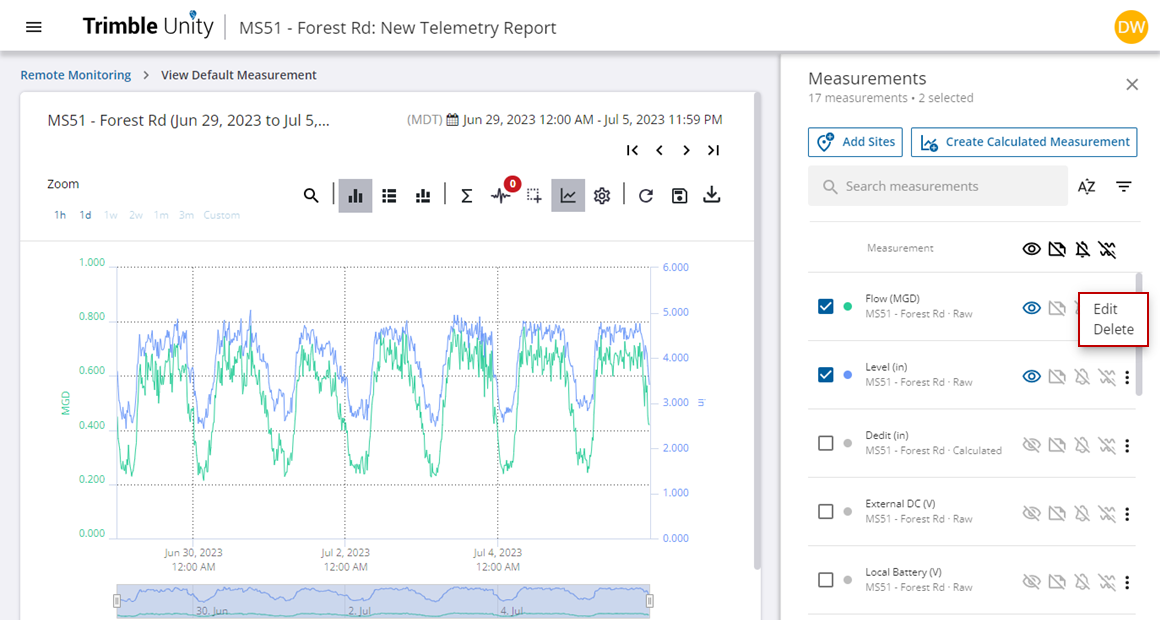
Time series data can also be graphed from the Measurements section of the site details panel.
- Select a site from the site list or on the map.
- In the Measurements section on the site details panel, click one measurement to open the telemetry report and graph the measurement.
- Alternatively, select two or more measurements, then click the graph measurements icon.
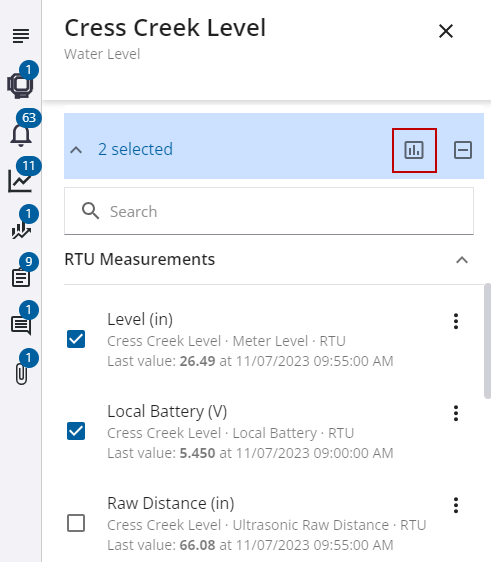
The telemetry report populates with the selected measurements. You can filter measurements by typing in the Search measurements field at the top of the Measurements panel.
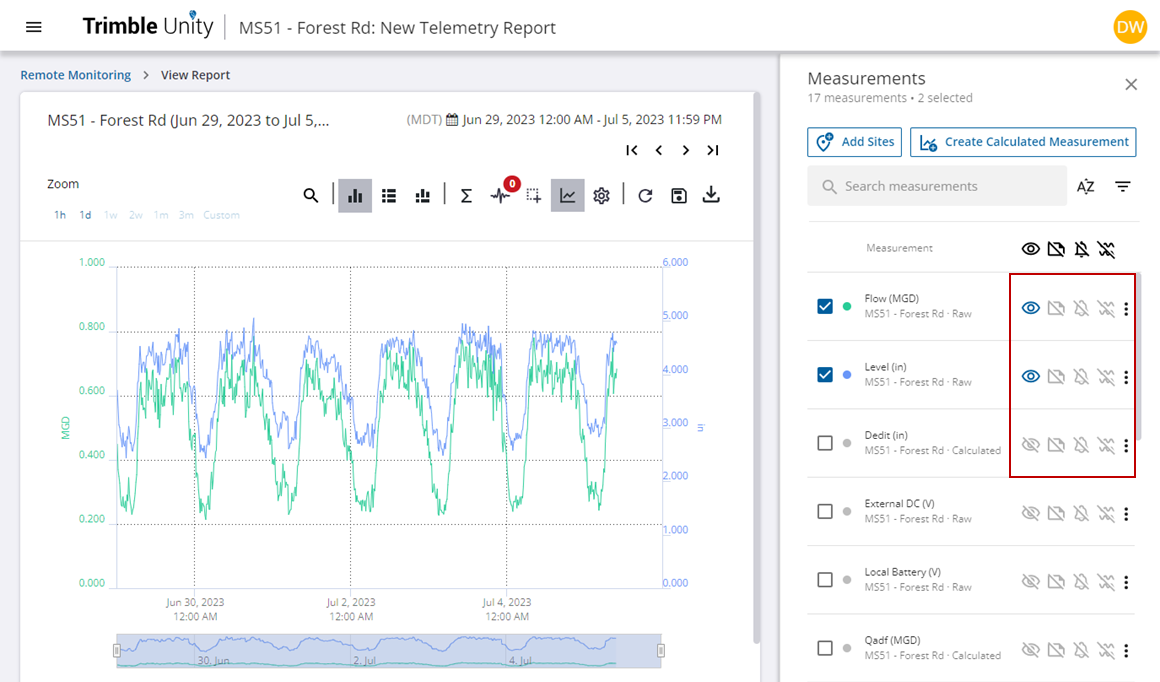
 NOTE: You can add additional sites from the Measurements panel. See Add Sites from the Measurement Panel in View Measurements and Reports Across Multiple Sites for more information.
- Click Create Calculated Measurements to create a new measurement. See Create Calculated Measurements for more information.
- Click the Measurement Visibility icon to view or remove the measurement from the graph.
- Click the Annotations Visibility icon to view or remove annotations from the graph.
- Click the Alarms Visibility icon to view or remove alarms from the graph.
- Click the Min Max Visibility icon to view or remove minimum and maximum values from the graph. This setting can be applied to measurements assigned to RTU channels configured to record minimum and maximum values, or it can be enabled when a compression interval is set on the Settings > General tab. See General Tab for more information.
You can edit or delete an existing measurement. See Edit Measurements or Delete Measurements for more information.