View Measurements and Reports Across Multiple Sites
Measurements and reports can be viewed across multiple sites, such as multiple sites measuring pressure or flow on the same pipeline.
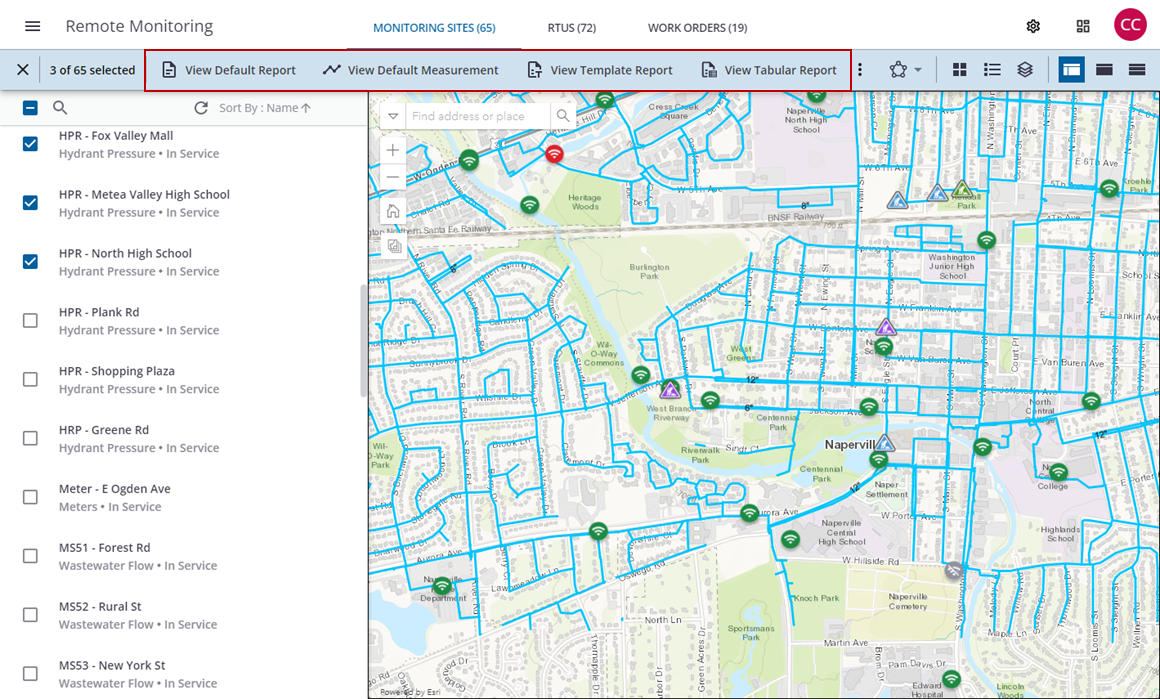
- Select the sites you want to view by selecting them in the site list or selecting them on the map using the polygon selection tool.
 TIP: You can use <Shift+click> to select multiple sites at a time. You can open a graphical or tabular report that includes all the selected sites.
- Click View Default Report, View Default Measurement, View Template Report, or View Tabular Report.
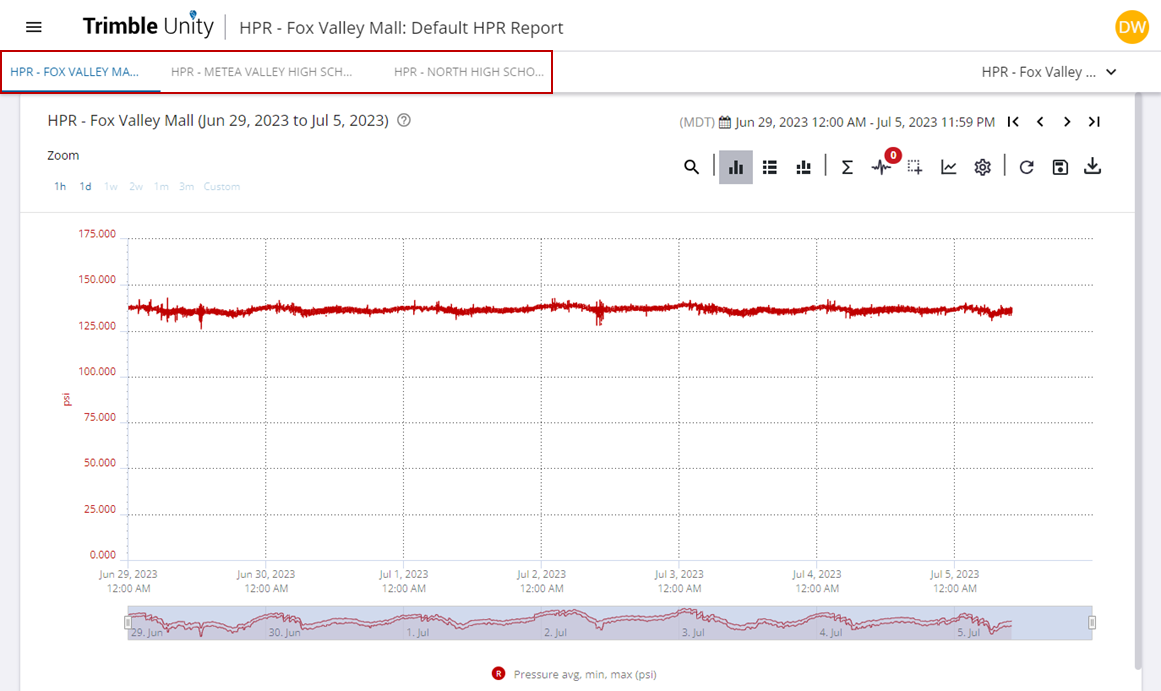
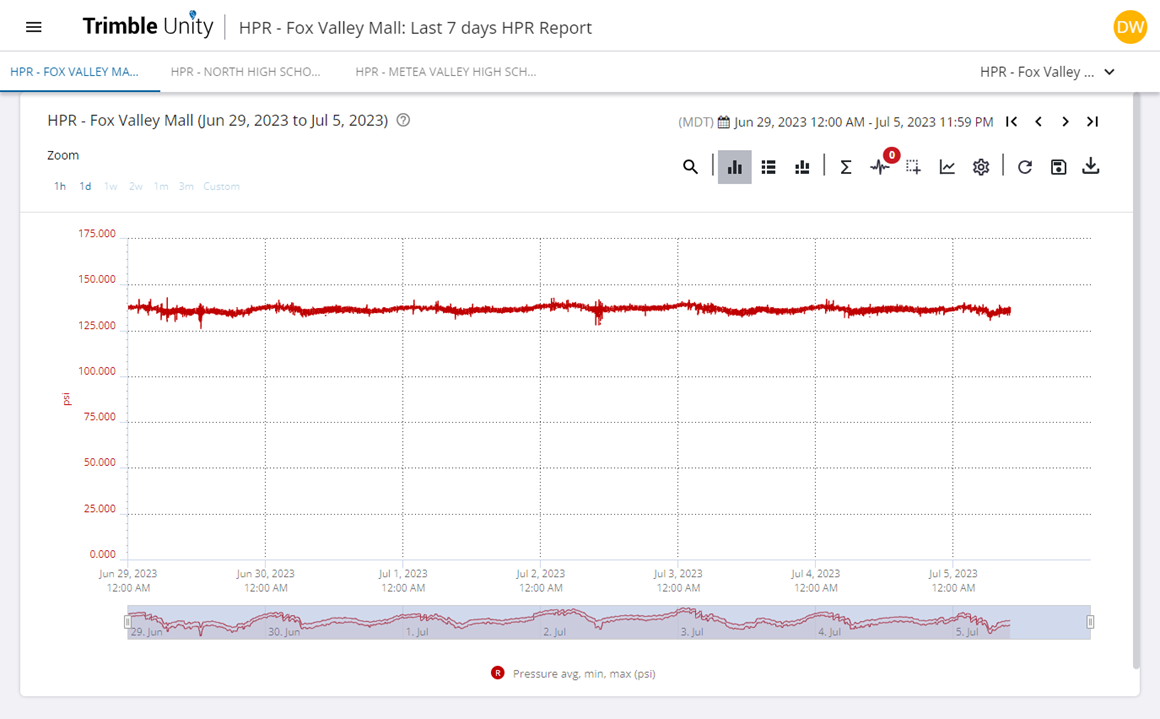
This option shows the default report for each of the selected sites in separate tabs.
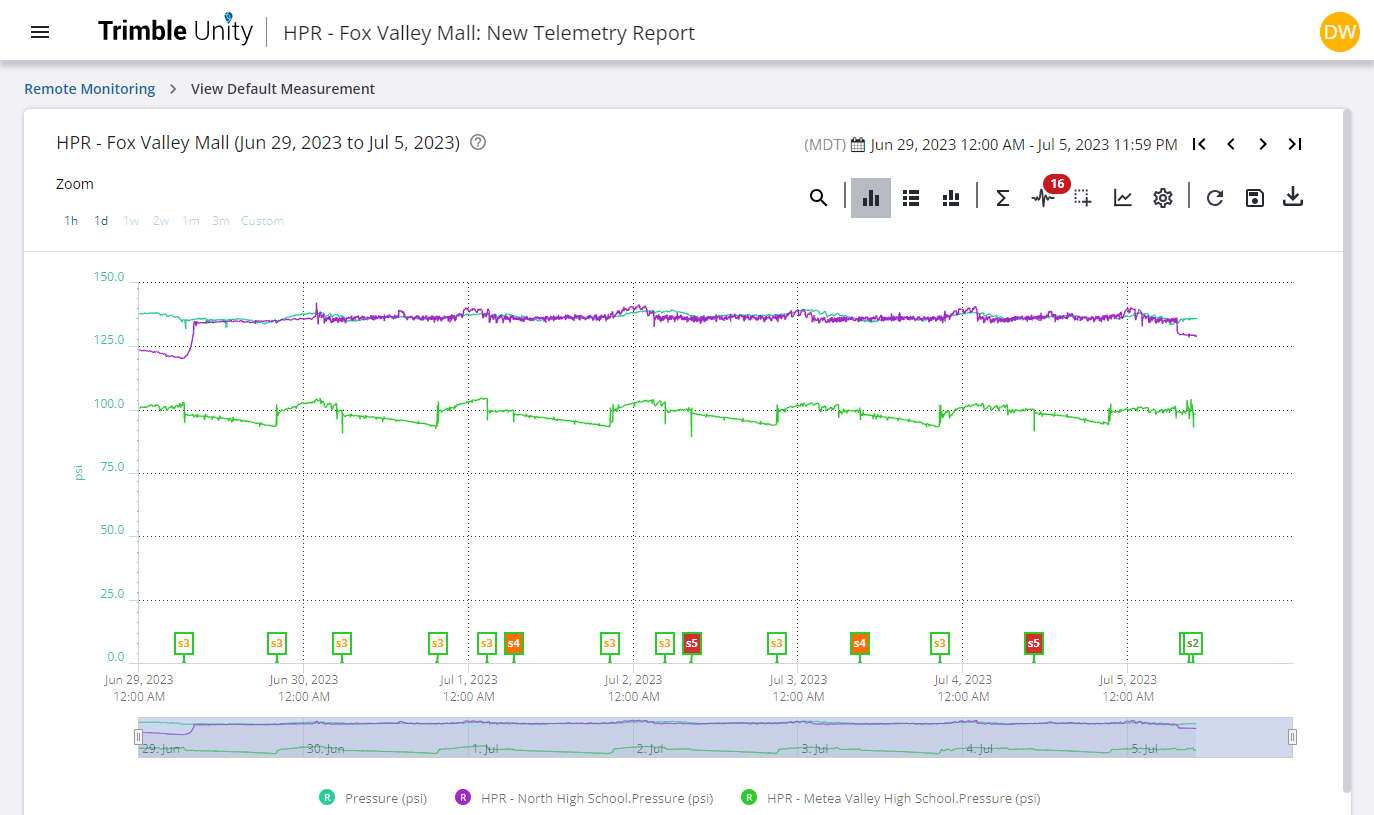
This option shows a single telemetry report with the default measurement for the selected sites graphed on the same report. This option is used to compare trends across multiple sites.
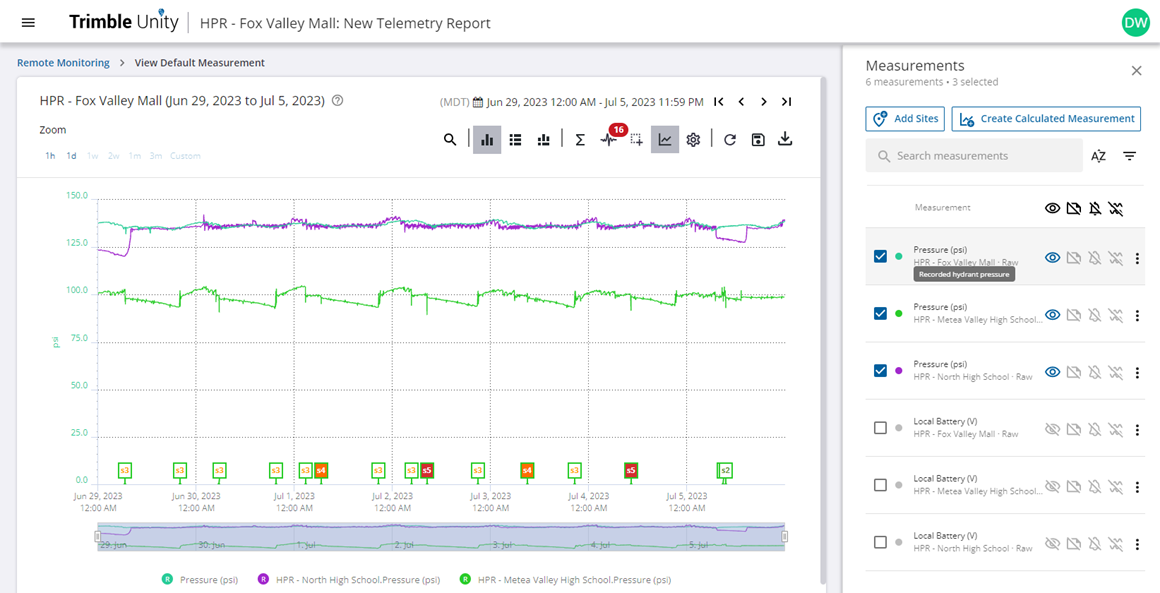
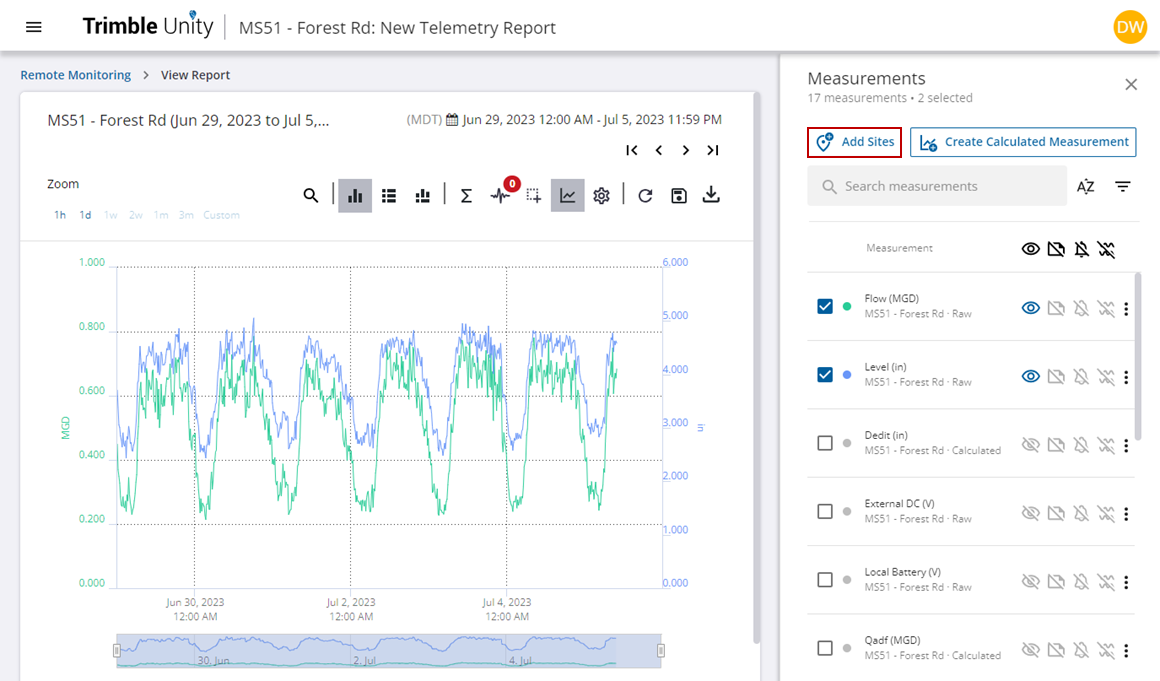
- Click View Measurements to open the Measurements panel.
Measurements for all selected sites appear in the panel, and any selected measurements are shown at the top of the list. From here you can filter, search, and select different measurements to view on the graph. When the panel is refreshed (like when you close and reopen the Measurements panel or sort/filter the list), any selected measurements appear at the top of the list.
 NOTE: The measurement's description appears when you hover over the measurement in the panel.
You can add additional sites and measurements from the Measurements panel. See Add Sites from the Measurement Panel for more information.
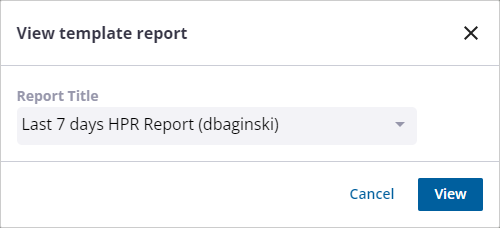
This option gives you the ability to select a template report to run for the selected sites. The selected template report for each of the selected sites is shown in separate tabs.
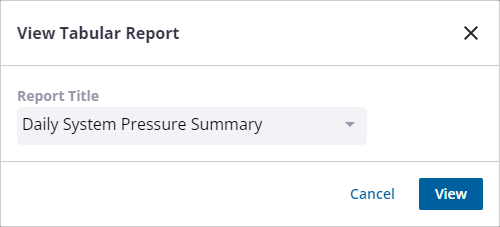
This option gives you the ability to select a tabular report to run for the selected sites, such as the Daily System Pressure Summary report. All of the selected sites must be compatible with the report type.
- Select a report from the Report Title drop-down list and click View.
The selected tabular report for each of the selected sites is shown.
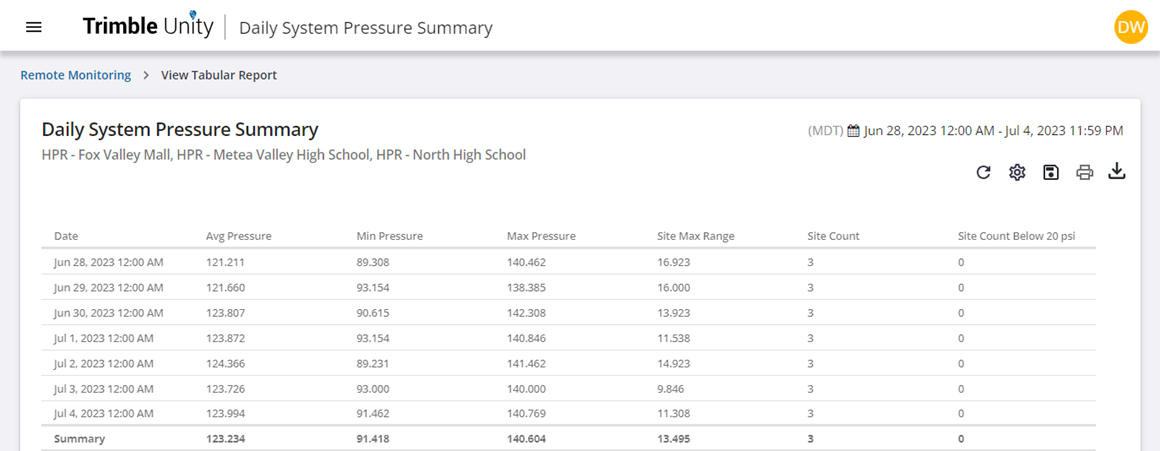
See View Tabular Reports for more information on different tabular reports and data they provide.
From the telemetry report, you can add and graph measurements from other sites. Open the Measurements panel and follow the instructions below to add measurements from other sites.
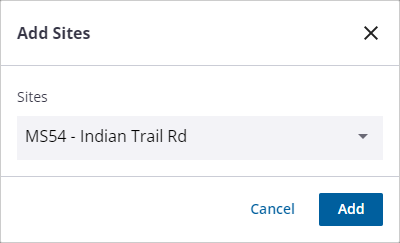
- Click Add Sites.
The Add Sites panel opens.
- Select the site(s) you want to add from the Sites drop-down list. You can start typing a site name to filter the list.
- Click Add once you have selected the site(s).
NOTE: The type of site you can add is not limited to the type of site you are currently viewing a report for. For example, if you are currently viewing a report that includes a site for pump run-time cycles, you can add a site that includes pressure data and view the information together.
The site measurements are added to the list in the Measurements panel. You can now select any measurements from the site you added as well as from the previous sites. Selected measurements are shown at the top of the list. You can filter measurements by typing in the Search measurements field at the top of the Measurements panel.
If you want to save the report, see Save Telemetry Reports for more information.