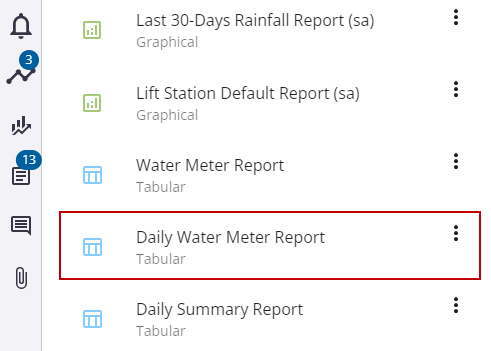
View Tabular Reports
Tabular reports provide requested data determined by the type of monitoring site and default measurements. These are automatically created and found in the site details panel in the Reports section. The tabular reports include the Daily Summary Report, Daily Flow Summary Report, Daily Lift Station Report, Multi Lift Station Daily Summary Report, Multi Lift Station Monthly Summary Report, Daily System Pressure Summary Report, Avg Daily System Pressure Summary Report, and Water Meter Report.
This reports the daily summary using the site's default measurement. It applies to all site types except Default and Other, which do not have a default measurement.

The following fields are found in this report:
- Columns:
- Date: reporting date
- Daily Min: minimum daily reading
- Daily Avg: average daily reading
- Daily Max: maximum daily reading
- Percent Data:
- Time of Min: time that the minimum reading occurred
- Time of Max: time that the maximum reading occurred
- Summary:
- Daily Min: minimum for the reporting period
- Daily Avg: average for the reporting period
- Daily Max: maximum for the reporting period
- Percent Data:
- Time of Min: date and time of the minimum reading
- Time of Max: date and time of the maximum reading
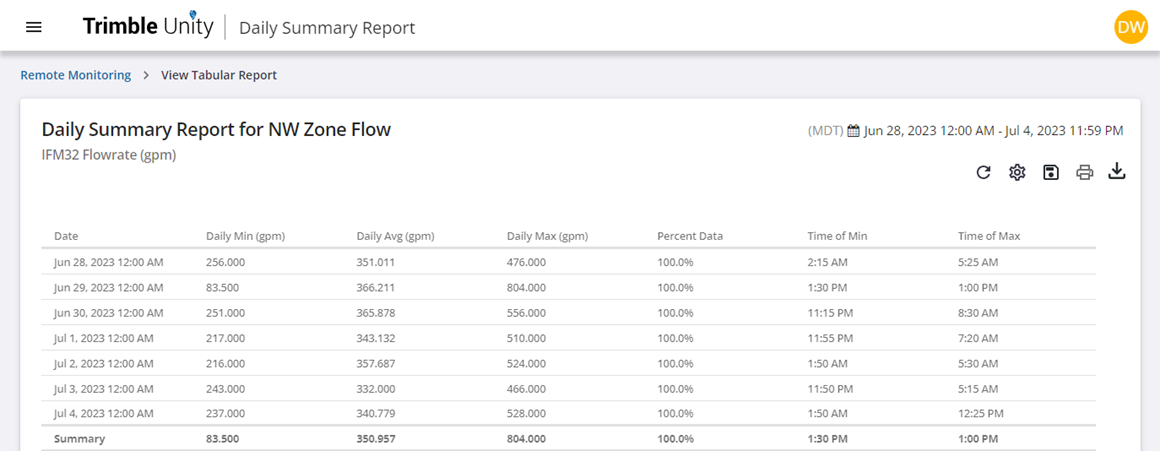
 NOTE: If an RTU is configured to store minimum and maximum values, these values are utilized in the report. If only average values are being stored, the minimum and maximum average values are reported.
This reports the site's default flow measurement. It applies to Gas Flow (Gas Flow Stnd Rate), IFM32 Flow Meter (IFM32 Flow Rate), Sewer Overflow (Meter Flow), and Wastewater Flow (Meter Flow) site and measurement types.
The following fields are found in this report:
- Columns:
- Date: reporting date
- Daily Min: minimum daily flow
- Daily Avg: average daily flow
- Daily Max: maximum daily flow
- Daily Total: total flow volume for the day
- Percent Data:
- Time of Min: time that the minimum flow occurred
- Time of Max: time that the maximum flow occurred
- Summary:
- Daily Min: minimum across the reporting period
- Daily Avg: average across the reporting period
- Daily Max: maximum across the reporting period
- Daily Total: total flow volume for the reporting period
- Percent Data:
- Time of Min: date and time of the minimum reading
- Time of Max: date and time of the maximum reading
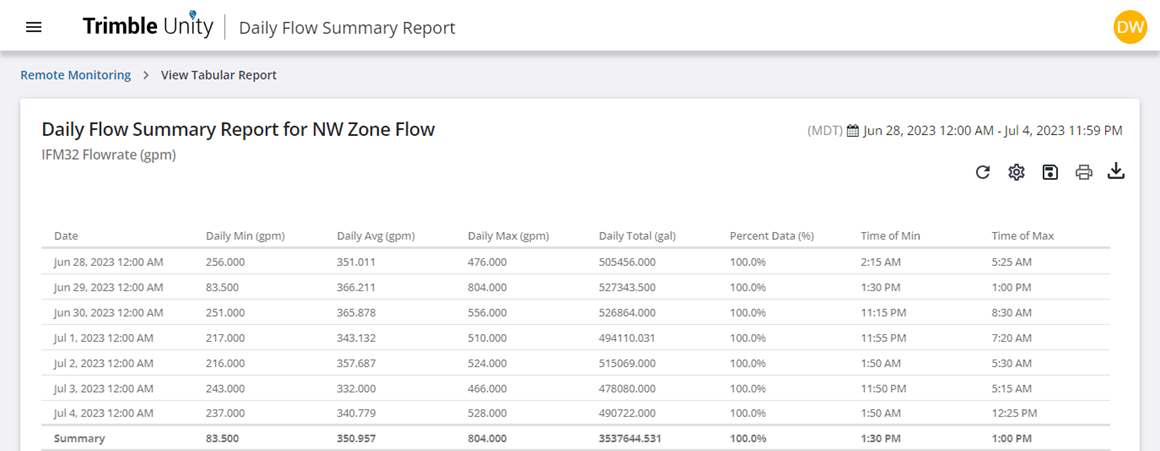
NOTE: If an RTU is configured to store minimum and maximum values, these values are utilized in the report. If only average values are being stored, the minimum and maximum average values are reported.
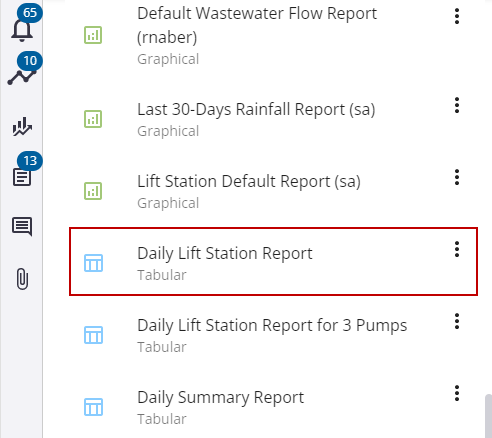
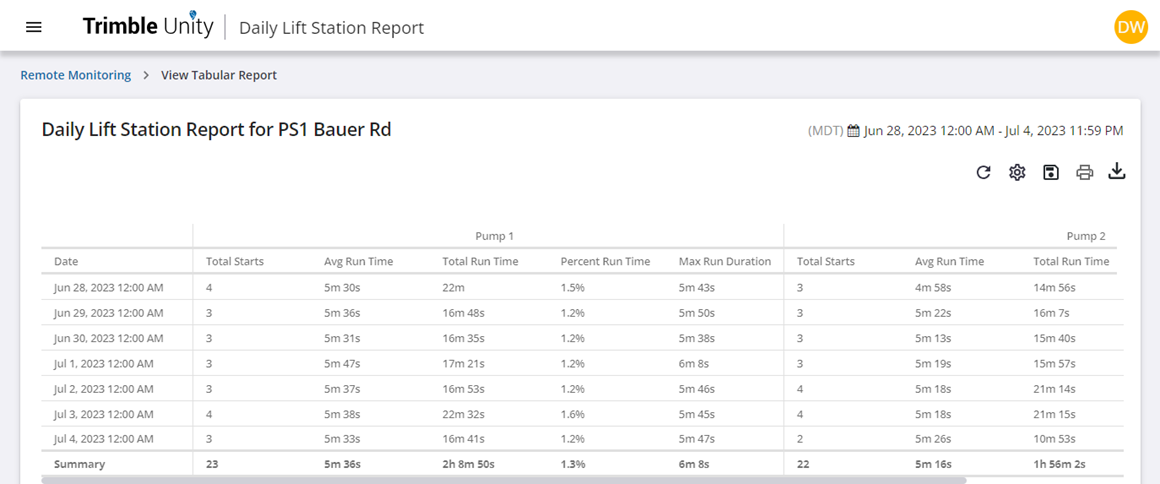
This reports the pumping activity for stations containing up to two pumps. It applies to lift stations site types with Pump 1 Run Event and Pump 2 Run Event measurement types.
The following fields are found in this report:
- Columns:
- Date: reporting date
- Pump 1, Pump 2
- Total Starts: daily pump run count
- Avg Run Time: average daily duration of all pump runs
- Total Run Time: total daily duration that the pump ran
- Percent Run Time: daily percent that the pump ran
- Max Run Duration: duration of the day's maximum run
- Summary:
- Total Starts: total pump starts for the reporting period
- Avg Run Time: average daily duration of all pump runs
- Total Run Time: total daily duration that the pump ran
- Percent Run Time: percent run time for the reporting period
- Max Run Duration: duration of the maximum pump run for the reporting period
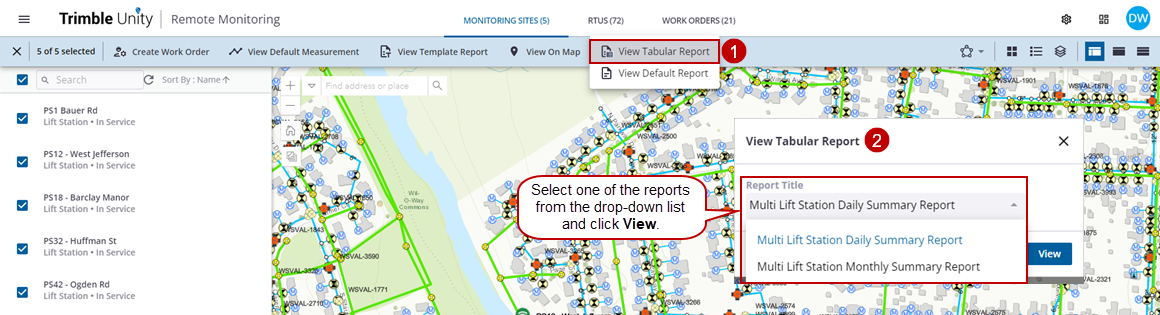
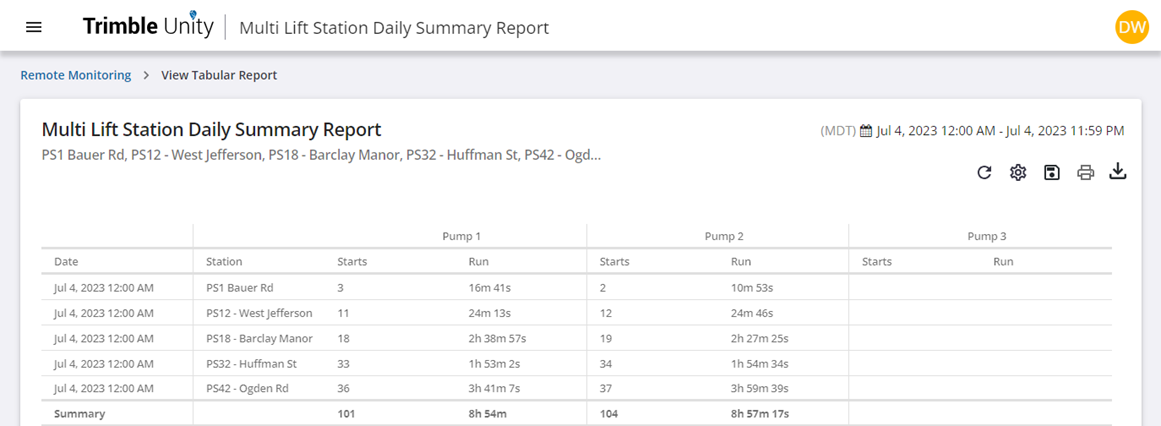
There are two reports that can be used when multiple lift stations are selected: Multi Lift Station Daily Summary and Multi Lift Station Monthly Summary. These reports include pump activity that are specified by the number of days or months for one or more lift stations; each lift station can also contain one to three pumps. These two reports are identical except for the aggregation period, such as daily vs. monthly. They include the daily or monthly total number of starts and run time for each pump. The number of starts and total run time should be similar for most two-pump stations.
These reports require that the pump event data measurements used to collect the pump start and stop events are assigned one of the three available pump measurement types: Pump 1 Run Event, Pump 2 Run Event, or Pump 3 Run Event.
The following fields are found in this report:
- Columns:
- Date: reporting date
- Pump #
- Station: name of the selected lift station
- Total Starts: daily/monthly pump run count
- Run: total daily/monthly duration that the pump ran
- Summary:
- Starts: daily/monthly pump run count for all stations
- Run: total daily/monthly duration that the pump ran for all stations
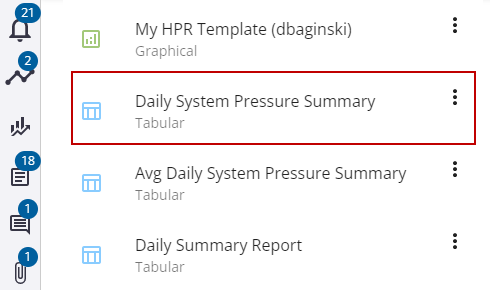
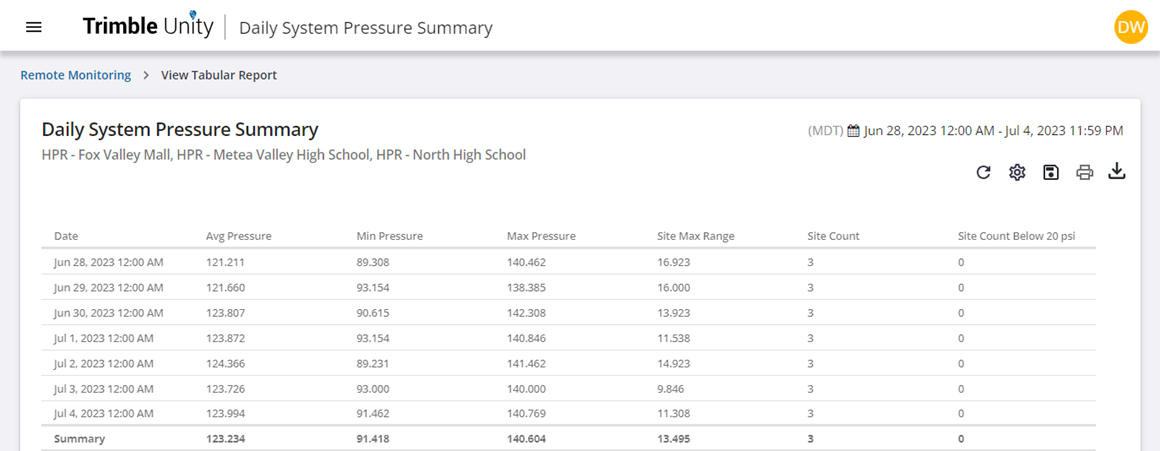
This reports the site's daily system pressure. It applies to Gas Pressure, Hydrant Pressure, and Water Pressure site types.
The following fields are found on this report:
- Columns:
- Date: The date reported.
- Avg Pressure: The daily average pressure across all selected sites.
- Min Pressure: The daily minimum pressure of the selected sites based on the RTU recording interval.
- Max Pressure: The daily maximum pressure of the selected sites based on the RTU recording interval.
- Site Max Range: The daily maximum pressure range of the selected sites, calculated for each site by subtracting Min Pressure from Max Pressure.
- Site Count: The number of sites reporting pressure for at least 75% of the day.
- Sites Count Below 20 psi: The number of sites that recorded a minimum pressure below 20 psi.
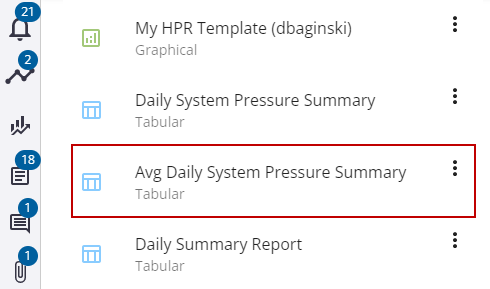
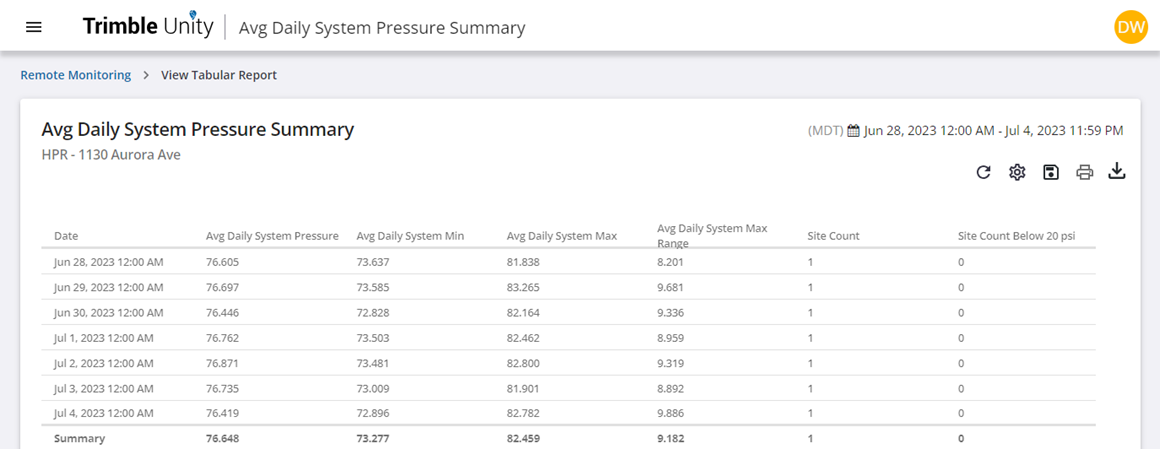
This reports the site's average daily system pressure. It applies to gas, hydrant, etc. pressure site types.
The following fields are found on this report:
- Columns:
- Date: The date reported.
- Avg Daily Pressure: The daily average pressure of the selected sites.
- Avg Daily System Min: The hourly minimum pressure of the selected sites.
- Avg Daily System Max: The hourly maximum pressure of the selected sites.
- Avg Daily System Max Range: The hourly maximum pressure range of the selected sites, calculated for each site by subtracting Avg Daily System Min from Avg Daily System Max.
- Site Count: The number of sites reporting pressure for at least 75% of the day.
- Sites Count Below 20 psi: The number of sites that recorded a minimum pressure below 20 psi.
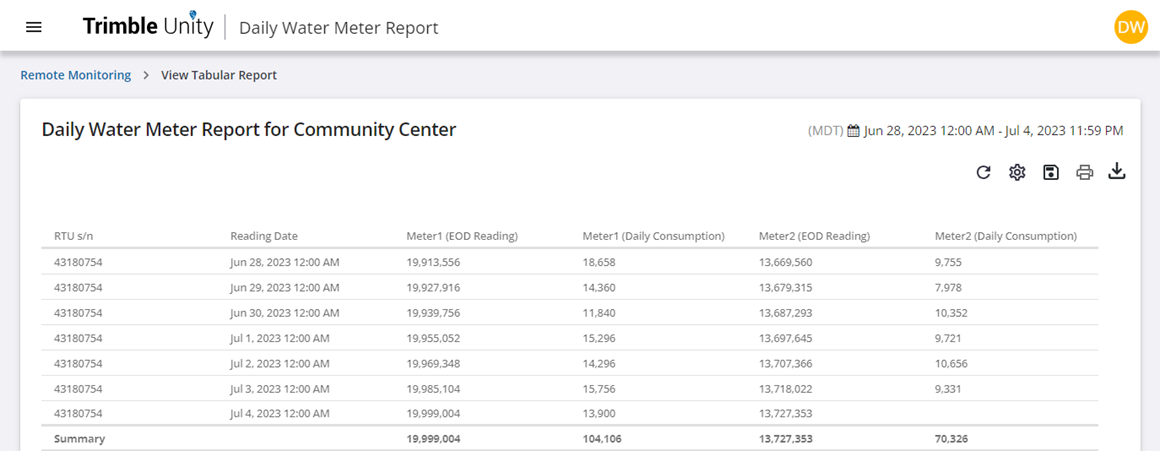
This reports the raw water meter readings and consumption data for up to two meters. It applies to Water Meter site types. For this report to populate, the user must be using the water meter inputs on either an MR-32, Ru-32imA, or Ru-32m RTU. The lower channel number is reported as meter 1, and the larger channel number is reported as meter 2.
The following fields are found in this report:
- Columns:
- RTU S/N: serial number of the installed RTU at the time of the reading
- Reading Time: the time the meter reading was taken (usually hourly)
- Meter 1, Meter 2:
- Reading: the value read from the meter
- Consumption: the consumption since the last reading (current reading minus previous reading)
- Summary:
- Meter 1, Meter 2:
- Reading: the value of the last reading
- Consumption: total consumption for the period (last reading to first reading)