System Health Dashboard
The System Health Dashboard allows you to monitor the health of your system with real-time insight into the availability and performance of the remote monitoring network and assets.
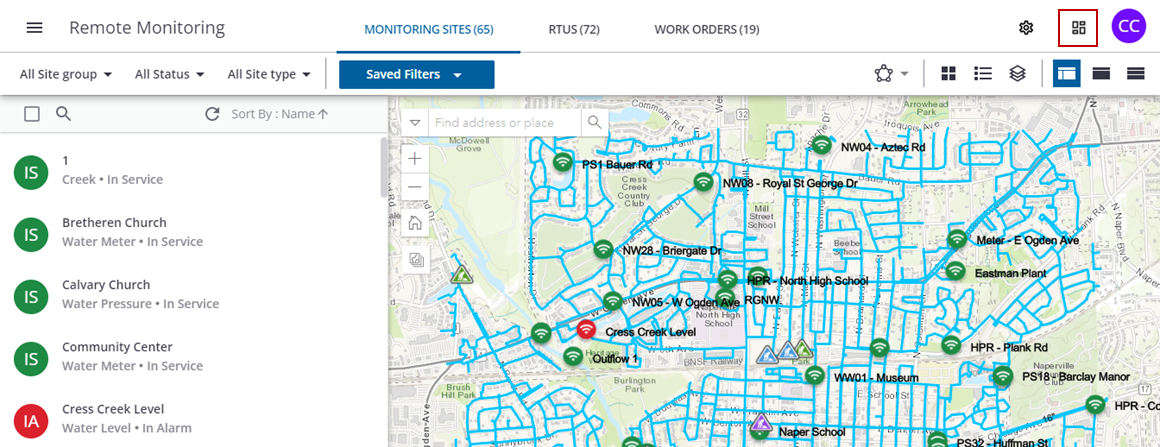
- Click Dashboard in the upper-right corner to open the System Health Dashboard.
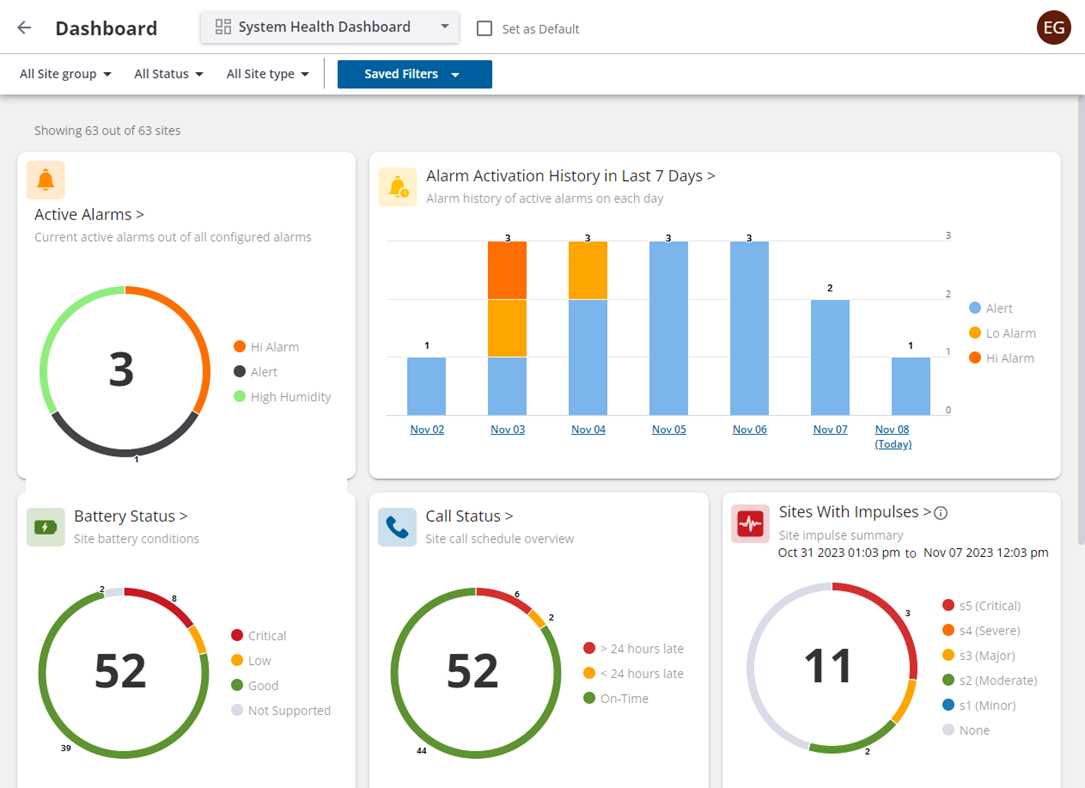
The System Health Dashboard includes widgets for active alarms, alarms activated in the last seven days, battery status, call status, sites with pressure impulses, and humidity sensor status.
 TIP: Scroll down to see all the widgets that are available.
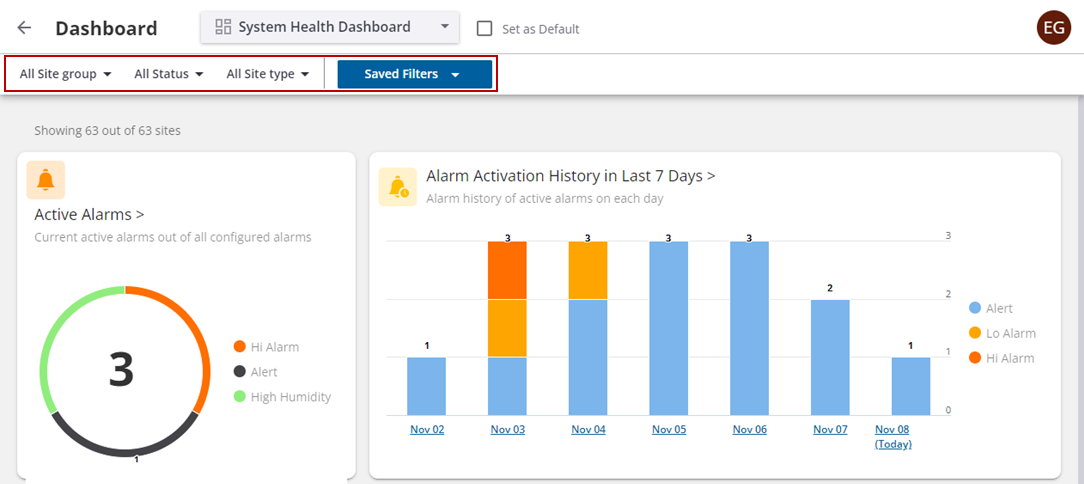
- You can filter the data in the dashboard based on the site group, status, and site type.
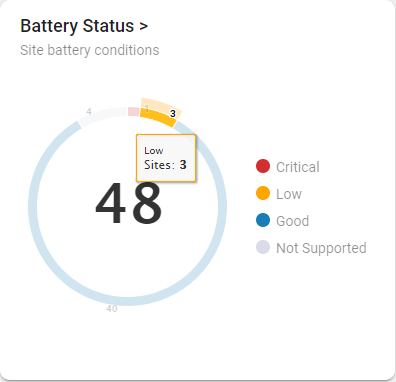
- Click a segment in any of the widgets to view the data.
The following list provides a description of each widget, as well as topics for more information.
- Active Alarms: View active alarms by type. See View and Filter Alarms for a Site for more information.
- Alarm Activation History in Last 7 Days: View alarm history for the last seven days. See View and Filter Alarms for a Site for more information.
- Battery Status: View the battery status for devices that support battery monitoring. See Monitor Battery Strength for more information.
- Call Status: View the status of calls from RTU devices. See Monitor Call Performance for more information.
- Sites with Impulses: View the total number of monitoring sites with impulses for the last seven days. See View and Analyze Pressure Impulses for more information.
- Humidity Sensor Status: View the humidity level status of RTU devices. See Monitor RTU Humidity Levels for more information.