View and Filter Alarms for a Site
There are three ways to view alarms:
Alarms can be viewed and filtered from the site details panel.
- Select a site from the list on the main page or on the map.
- Click the Alarms icon or scroll down to the Alarms section to view the most recent alarms for this site. The number of alarms is indicated on the Alarms icon badge.
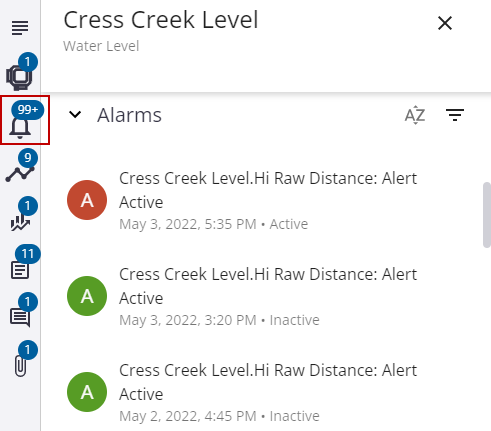
- Click the arrow icons at the bottom of the Alarms section to view more alarms.
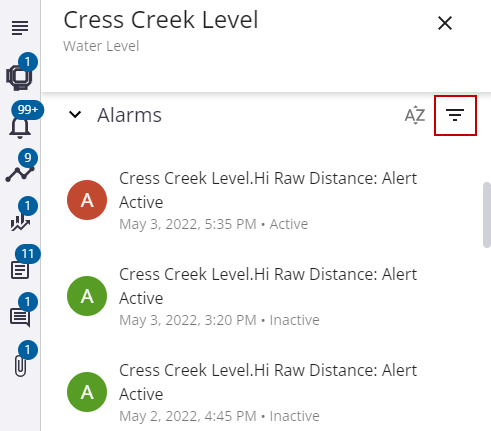
- Click the Filter Alarms icon to filter the list of alarms.
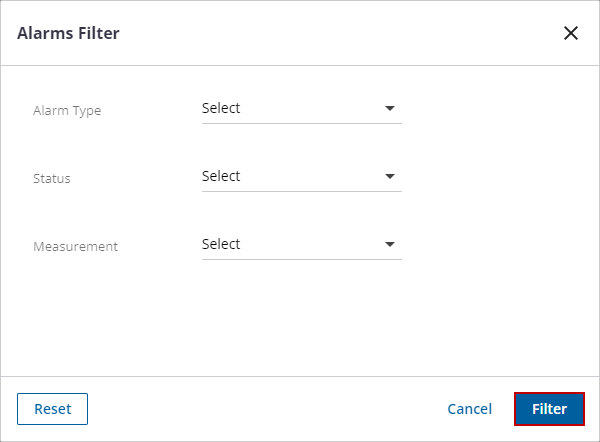
- In the panel that opens, select the desired filters for Alarm Type, Status, and Measurement.
- Alarm Type: Select the type of alarm to filter by, such as Alert Active, Hi Alarm, HiHi Alarm, Lo Alarm, or Lolo Alarm. Select All to view alarms of any type.
- Status: Select Active to filter the list for alarms that are currently active or select Inactive to filter the list for alarms that are no longer active. Select All to view alarms of any status.
- Measurement: Select the measurement that triggered the alarm. Select All to view alarms triggered by any measurement.
- Once you have selected the desired filters, click Filter to apply them.
Any applied filters are shown at the top of the Alarms section.
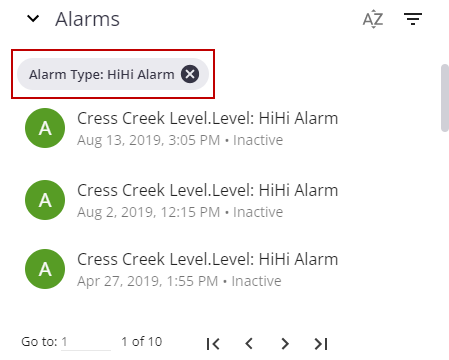
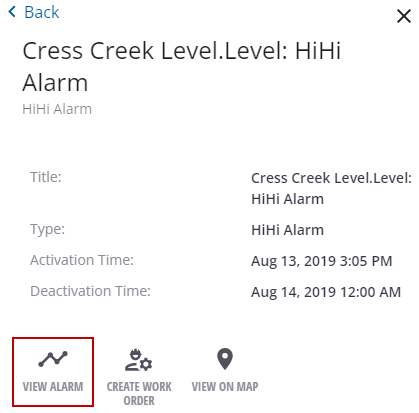
- Select an alarm to view the alarm details, such as when it was activated and deactivated.
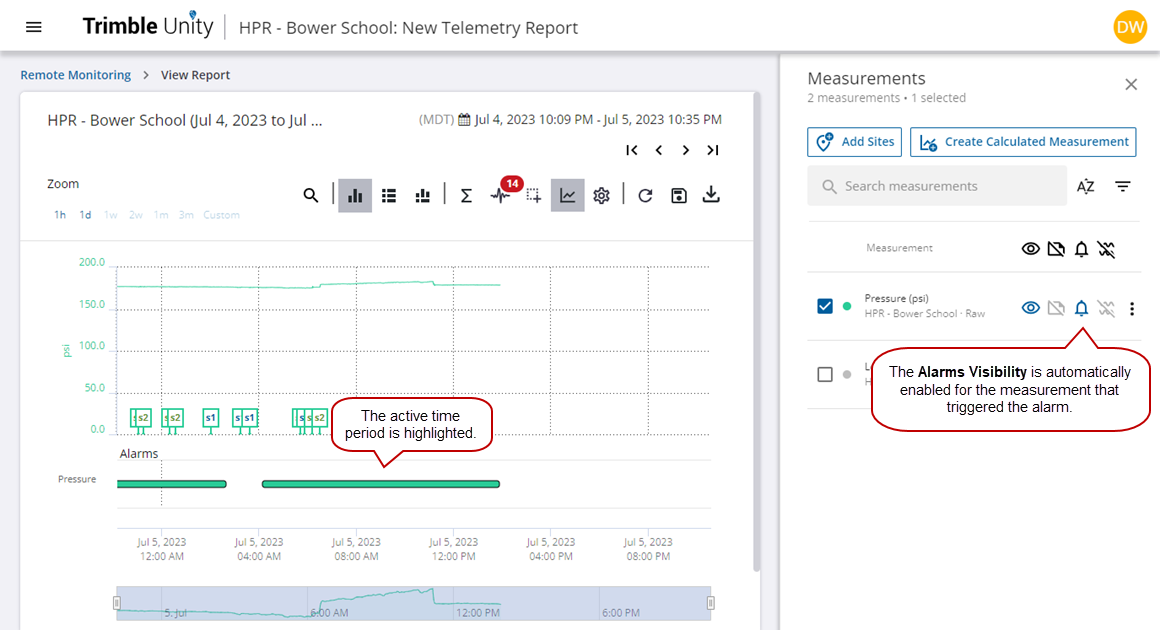
- Click View Alarm to view the measurement when the alarm occurred.
The time period that the alarm was active is highlighted on the graph, and the Alarm Visibility is automatically enabled for the measurement that triggered the alarm.
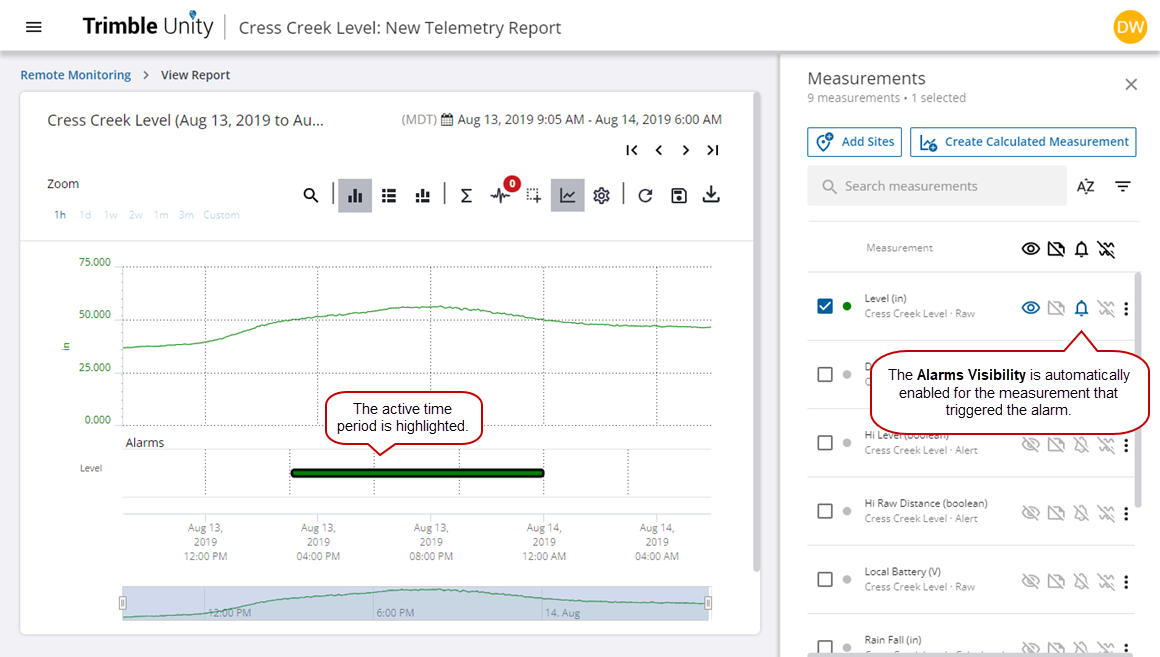
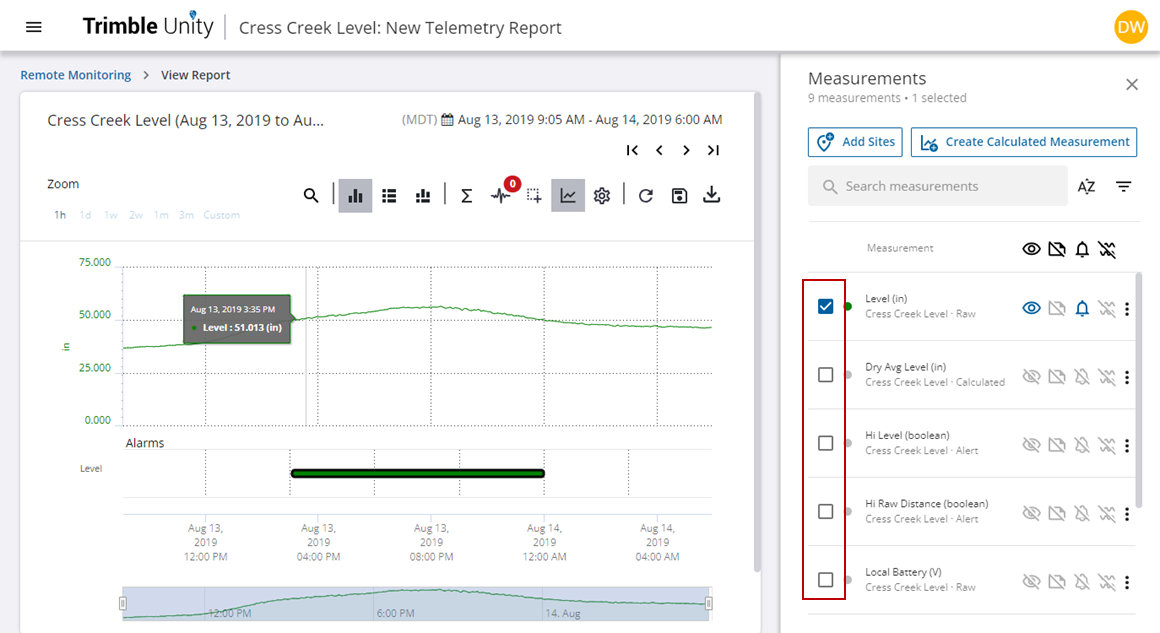
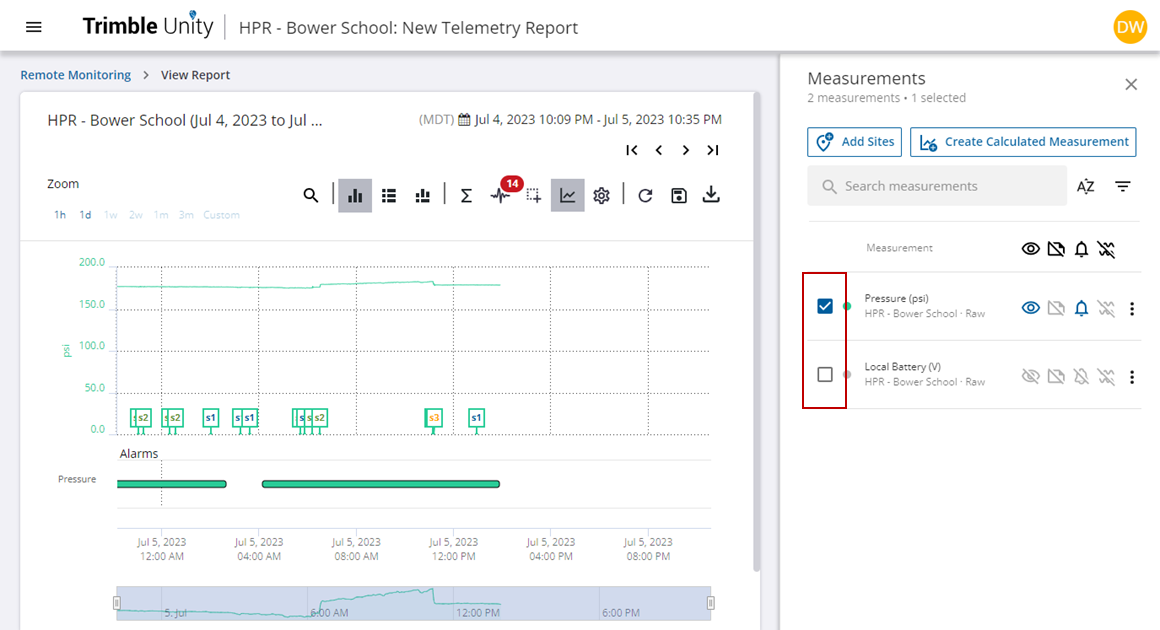
- You can select additional measurements to add to the graph to aid in the analysis of the underlying factors that caused the alarm.
Alarms can be viewed and filtered from the System Health Dashboard.
- Open the System Health Dashboard. See System Health Dashboard for more information.
- In the Active Alarms widget, click the widget name, legend, or any part of the circle graph to open the active alarm details.
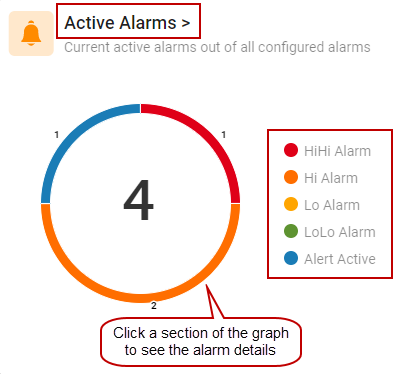
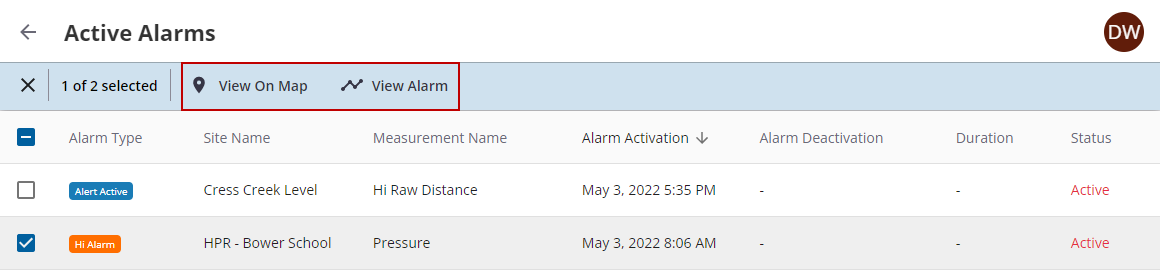
The Alarm Type, Site Name, Measurement Name, Alarm Activation, Alarm Deactivation, Duration, and Status are listed.
- Select the check box on one or multiple alarms.
- Click View on Map to view the site locations of the alarms on the map.
- Click View Alarm to view the telemetry report with the alarm data and measurements.
The time period that the alarm was active is highlighted on the graph, and the Alarm Visibility is automatically enabled for the measurement that triggered the alarm.
- You can select additional measurements to add to the graph to aid in the analysis of the underlying factors that caused the alarm.
Alarms can be viewed and filtered from the map. Sites with active alarms have red symbols on the map.
- Click a site with an active alarm on the map to open the site details.
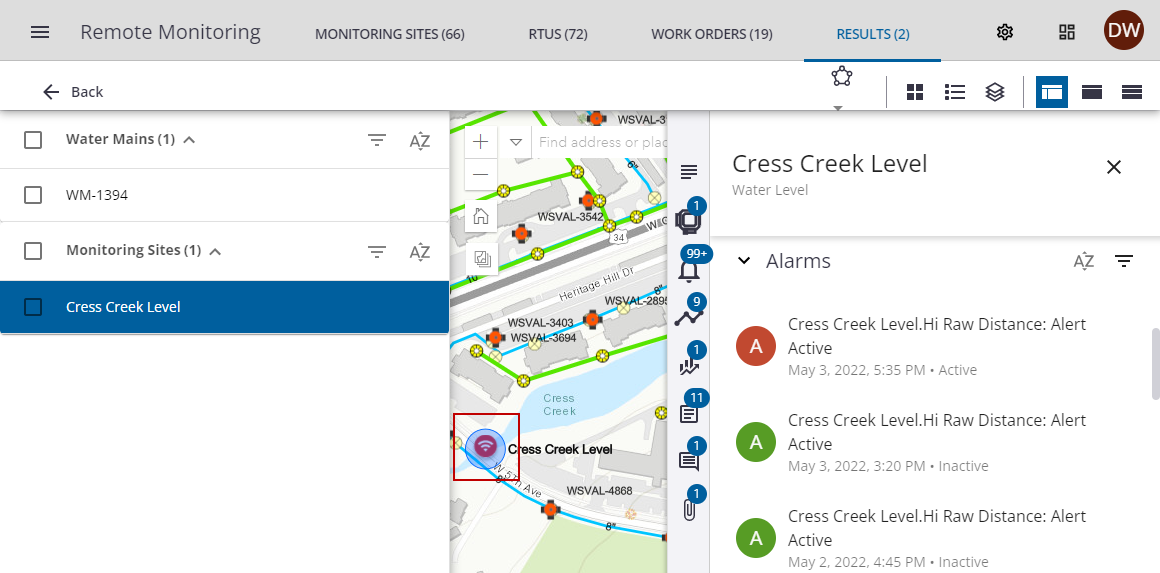
- Click the Alarms icon or scroll down to the Alarms section to view the most recent alarms for this site. The number of alarms is indicated on the Alarms icon.
Refer to the From the Site Details section in this topic for the rest of the steps.