View and Analyze Pressure Impulses
If your organization deployed high resolution pressure recorders to record pressure impulses, Trimble Unity RM has specific capabilities to help you identify those impulses to analyze the underlying causal factors.
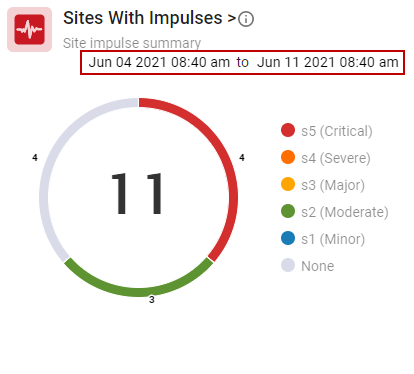
The impulse dashboard widget summarizes the total number of monitoring sites with impulses, which are categorized and color coded into five severity classifications, S1–S5, with S5 indicating the most severe. Severity is calculated as follows:
Let x = 2 * (max pressure - min pressure) / avg pressure
severity is indicated as
S5: when x >= 1
S4: when x >= 0.75
S3: when x >= 0.5
S2: when x >= 0.25
S1: when x < 0.25
where,
max pressure is the single highest pressure sample during the impulse,
min pressure is the single lowest pressure sample during the impulse,
avg pressure is the average of all pressure samples taken during the impulse.
Max pressure is the single highest pressure sample during the impulse. Min pressure is the single lowest pressure sample during the impulse. Average pressure is the average pressure for all samples that were taken during the impulse. So if there were 50 samples taken, it would be the average of those 50 samples.
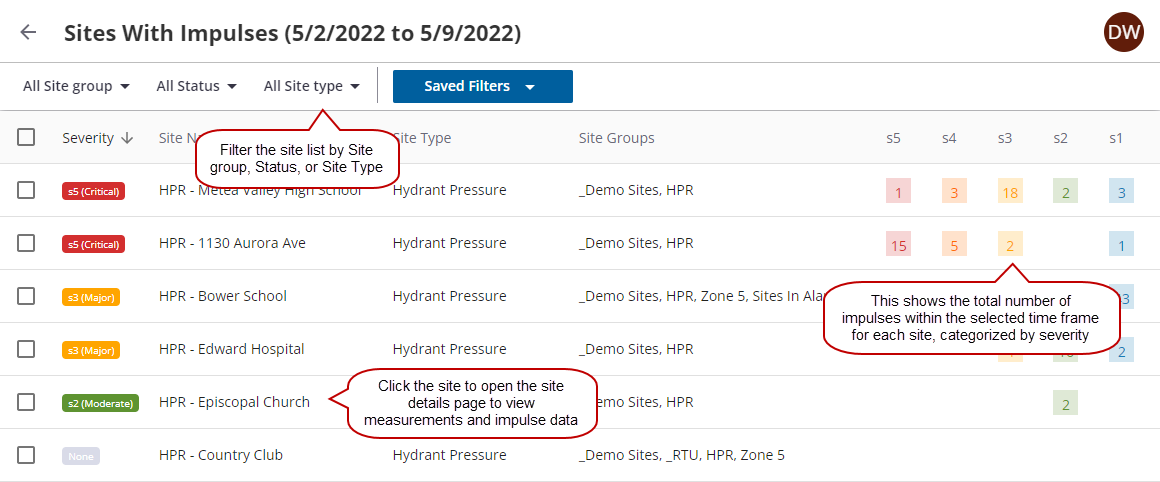
By default, this widget displays the last seven days. The date range can be changed or the list of sites can be filtered by impulse severity. This provides the tools needed to focus on sites with the most severe and damaging impulses.
- Open the System Health Dashboard.
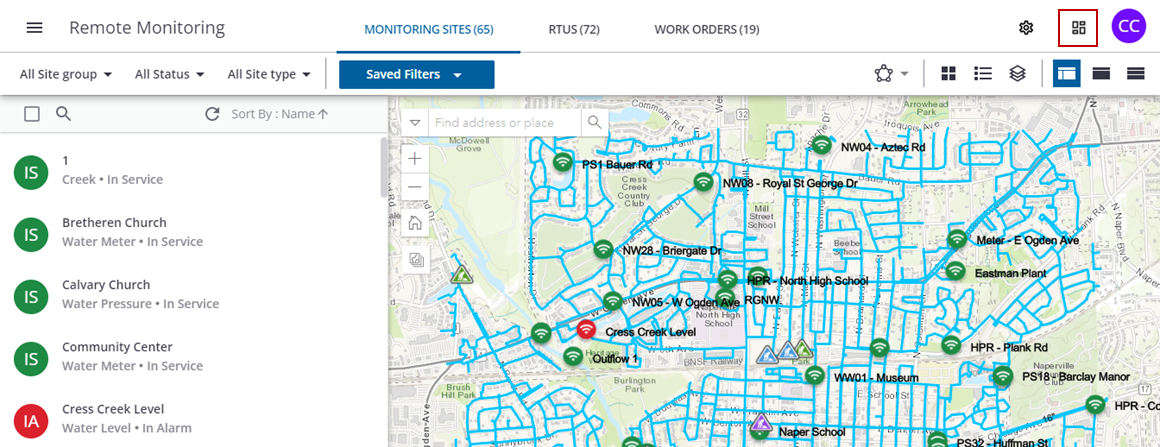
- On the Sites With Impulses widget, click the beginning and ending date ranges to filter the impulse summary.
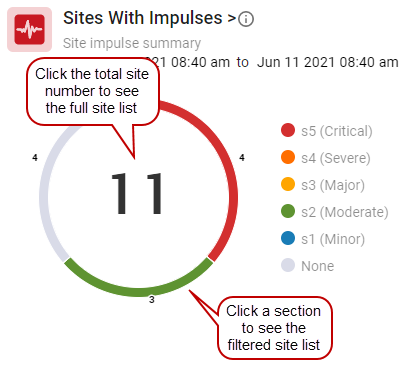
- Click the total site number or the widget title for a full site list, or click a colored section to see a filtered site list.
The list of sites shows the summary for every site with impulses as well as the number of impulses categorized by severity.
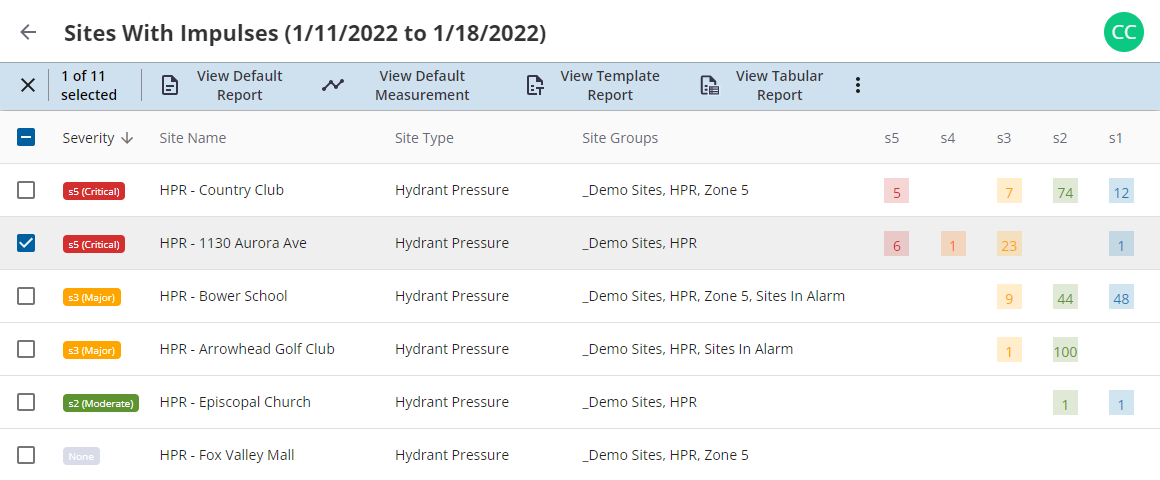
- Select one or more sites for more options:
- View Default Report: shows the default report for each of the selected sites in separate tabs.
- View Default Measurement: shows a single telemetry report with the default measurement for the selected sites graphed on the same report. This option is used to compare trends across multiple sites.
- View Template Report: gives you the ability to select a template report to run for the selected sites. The selected template report for each of the selected sites is shown in separate tabs.
- View Tabular Report: gives you the ability to select a tabular report to run for the selected sites, such as the Daily System Summary Pressure Report. All of the selected sites must be compatible with the report type.
- View On Map: highlights the selected sites and centers the map on their location.
- On the telemetry report, click View Impulses to open the Impulses panel.
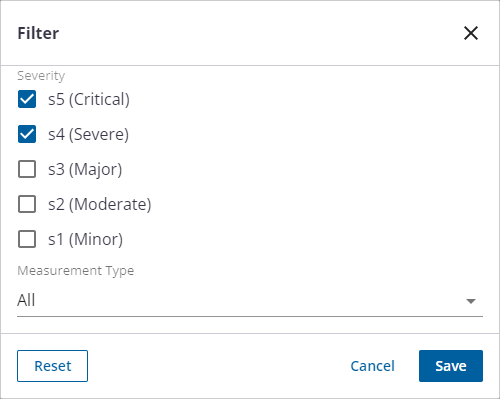
- You can search the list or click the filter icon to filter the list of impulses by severity.
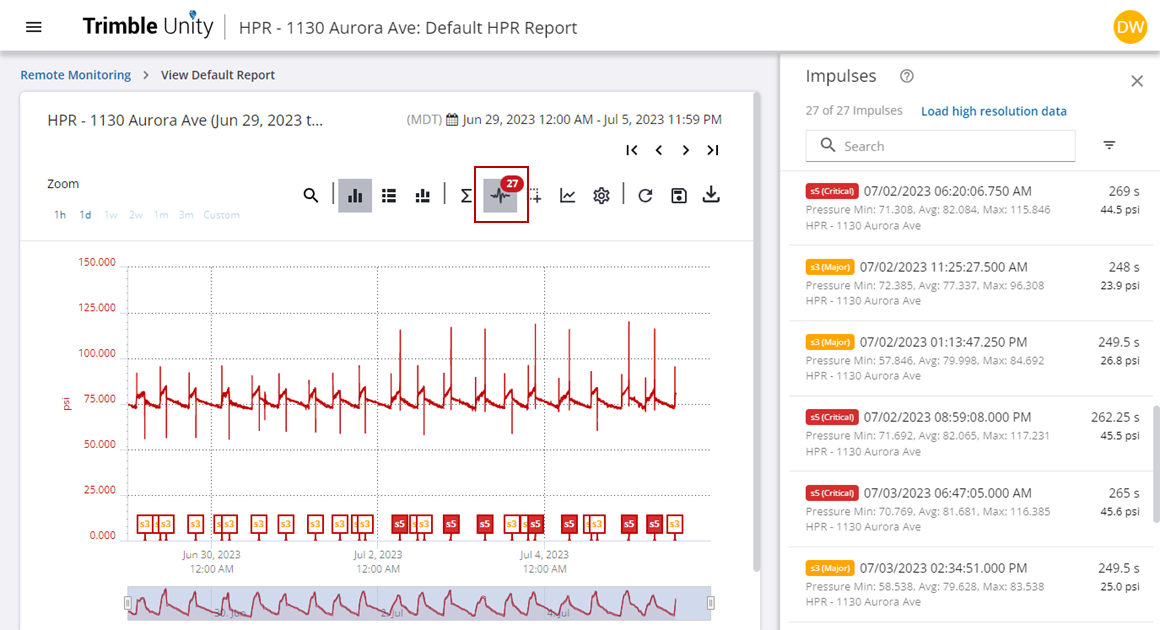
- Click to clear the check boxes of ones you don't want to view and click Save.