About the Monitoring Site Details
Site details are available for each monitoring site. These include general information about the monitoring site, RTU details, active alarms, measurements, KPIs, graphical and tabular template reports, annotations, and attachments.
- Select a site from the list or the map.
The site details panel opens and the selected site is highlighted on the map.
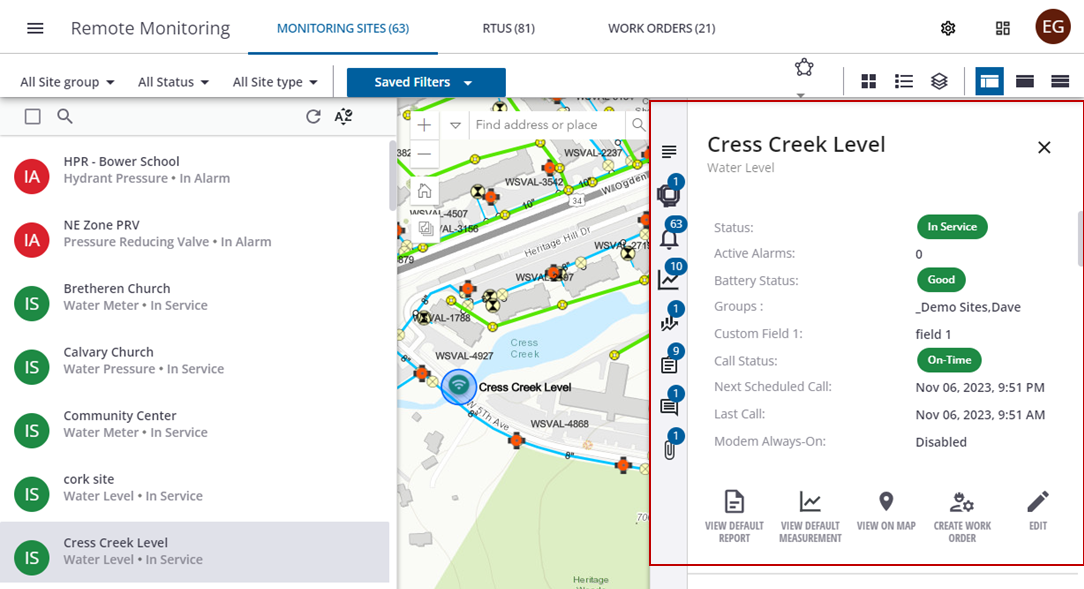
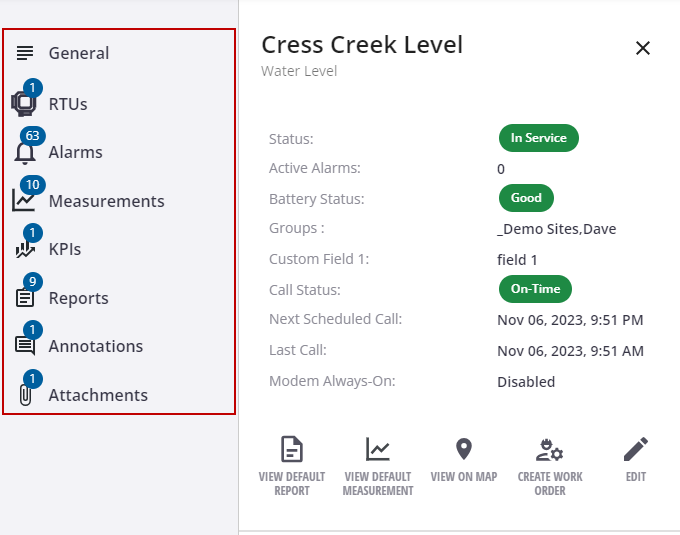
- Click the name or icon on the side menu to automatically scroll to the section, or scroll through the site details with the scroll bar or mouse.
 NOTE: The numbers on certain icons tell the number of available details in those sections. For example, one RTU, ten measurements, etc.
The General section includes information about the site, including type, status, description, battery status, and call status information.
NOTE: The Status, Battery Status, and Call Status icon colors change when the status changes. For example, when the Status is In Alarm, or the Battery Status is Critical, the icon colors change from green to red.
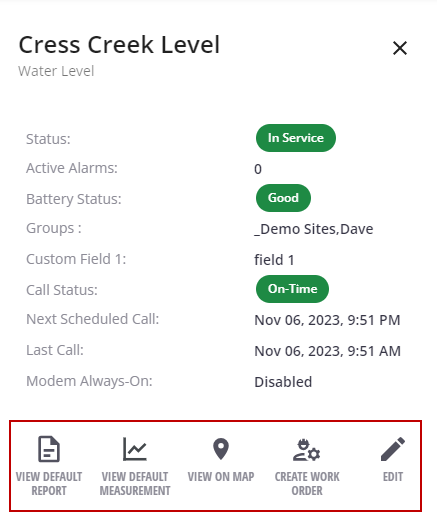
- From the General section, click an action icon.
- View Default Report: Opens the default telemetry report for this site. See Graph Measurements on a Site for more information.
- View Default Measurement: Opens the default measurement report for this site. See Graph Measurements on a Site for more information.
- Create Work Order: Create a battery replacement work order on this site. See Create a Battery Replacement Work Order for more information.
- Edit: Edit the general information of the site.
- View On Map: Highlight the selected site and center the map on its location.View On Map: Highlight the selected site and center the map on its location.
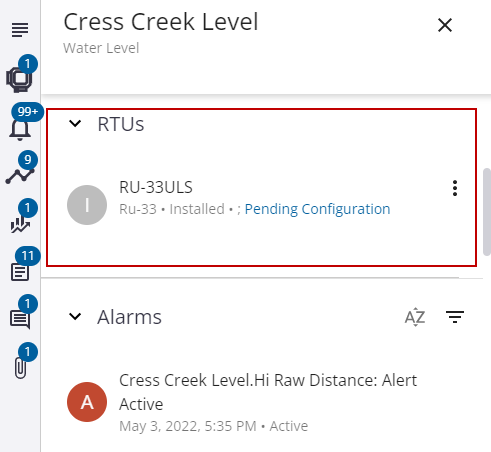
The RTUs section shows the device installed at this site, as well as the type, model, and serial number.
- Click an RTU to open the RTU details. See About the RTU Details for more information.
- Click the more icon next to an RTU to view it on the map.
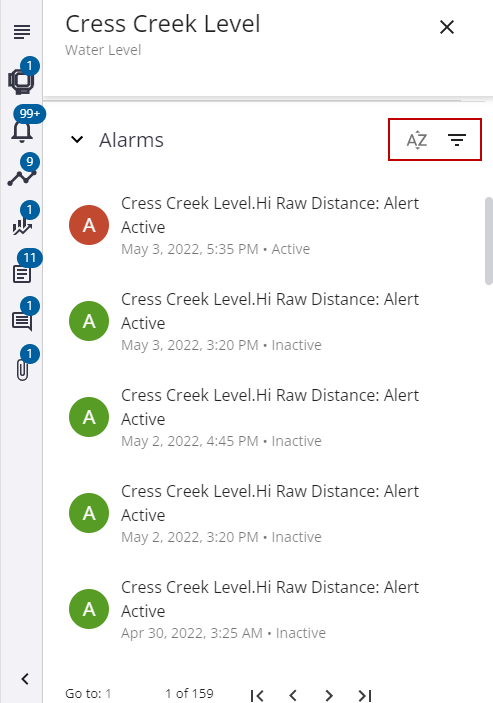
The Alarms section shows the alarms for this site, with the most recent at the top. Active alarms are displayed in red and past alarms are displayed in green.
- Click the sort or filter icons to sort or filter the list of alarms.
- Click the arrow icons at the bottom of this section to view additional pages of alarms, or to quickly click through to the earliest or most-recent alarms.
The Measurements section shows the measurements coming in for this site.
- Click the sort or filter icons to sort or filter the list of measurements.
- Select the check box to select all measurements at once.
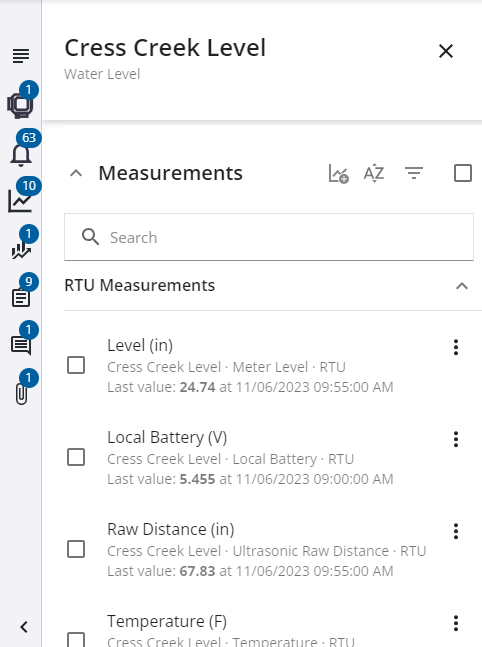
NOTE: The Last value line under each measurement in the list gives you a glimpse of the most recent average value, date, and time without having to open and run the report.
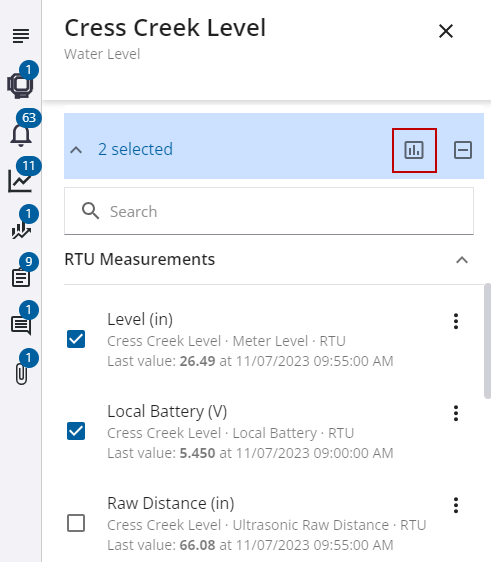
- Select one or more measurements from the list and click the graph measurements icon to create a report with the selected measurements. See Graph Measurements on a Site for more information.
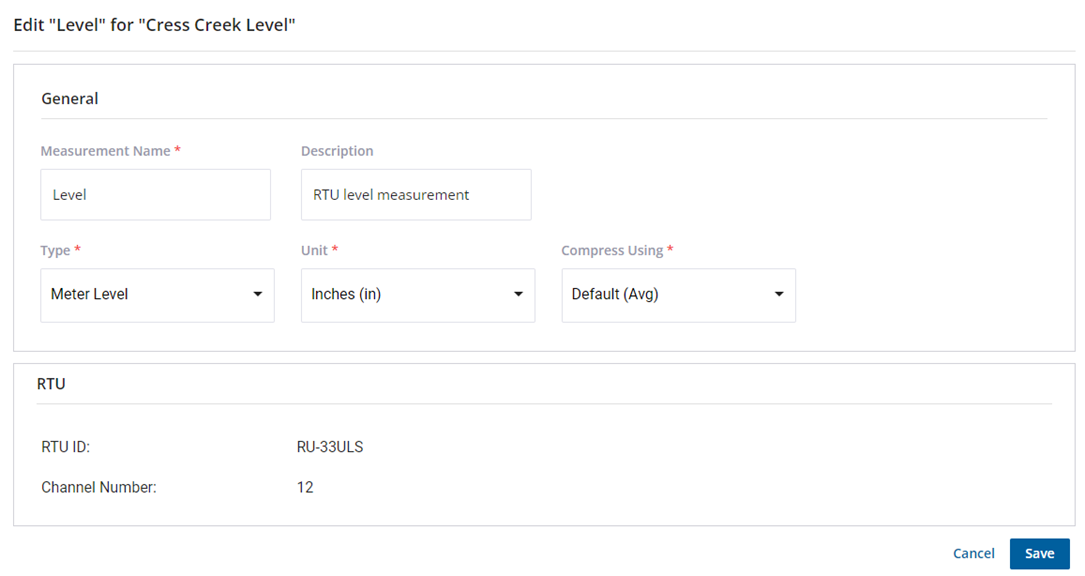
- Click the more icon next to a measurement to edit or update the measurement name or type or view the measurement in a report.
You can view the measurement in a report or remove the measurement from the site. You can also edit or update the measurement name, type, or measurement unit.
NOTE: When you change the measurement's type the units change as well and reflect the default units for the type selected. However, the units can be changed as needed.
- If you edit a measurement, click Save to save the updates made.
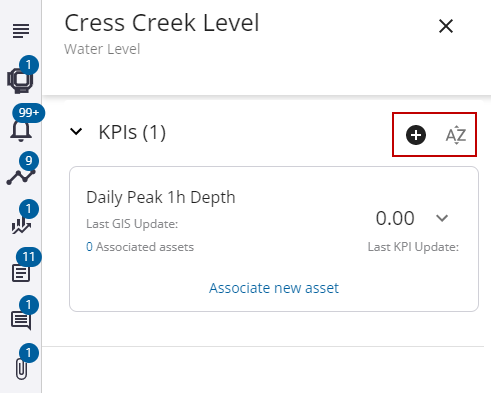
The KPIs section shows the KPIs associated with this site. See Enable and View Standard KPIs for Monitoring Sites for more information.
- Click the plus icon to add a KPI to the monitoring site, or click the sort icon to sort the list of available KPIs.
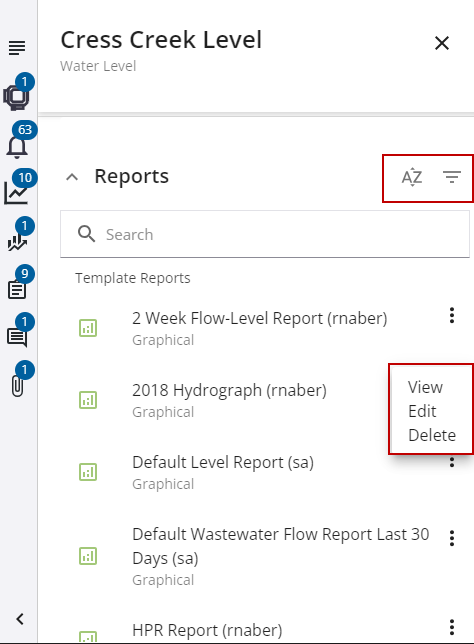
The Reports section shows the available graphical and tabular template reports for this site. See View Measurements and Reports Across Multiple Sites for more information on reports.
- Click the sort or filter icons to sort or filter the list of reports.
- Click the more icon next to a report to view or delete it.
The Annotations section shows any annotations associated with this site. Annotations can include information about anomalies like spikes or missing data.
- Click an annotation to view it on the telemetry report.
- Click the sort or filter icons to sort or filter the list of annotations.
- Click the arrow icons at the bottom of this section to view additional pages of annotations.
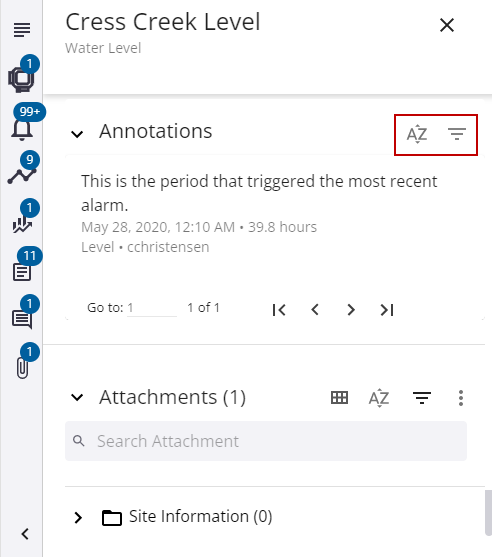
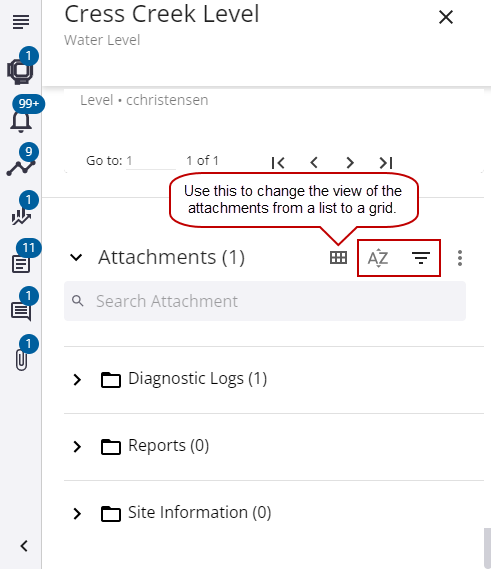
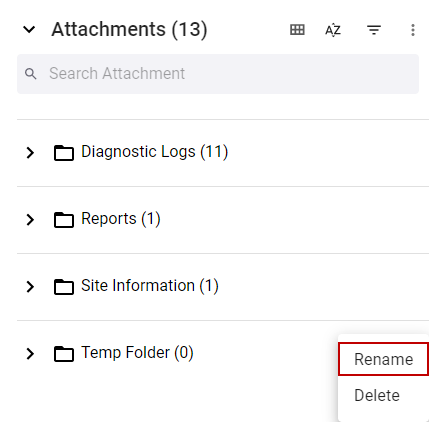
The Attachments section shows any attachments and folders for this site.
- Click the sort or filter icons to sort or filter the list of attachments.
You can add new folders and upload attachments. When you create new user folders, they are site-specific and can be removed or renamed. If the folder is removed, any attachments in the folder are also removed.
NOTE: There are three default folders (i.e., Diagnostic Logs, Reports, Site Information) for every site that cannot be renamed or deleted.
- To add a new folder, click the more options icon and select New Folder.
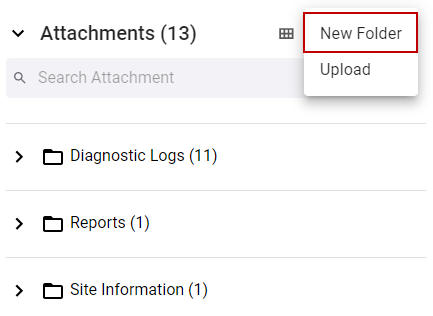
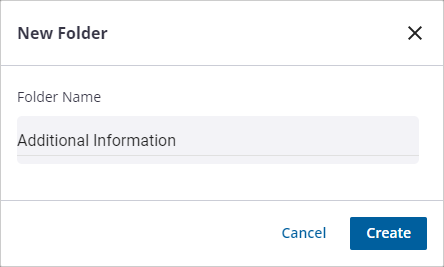
The New Folder panel opens.
- Enter the name for the folder and click Create.
- To add a new attachment, click the add icon and select Upload.
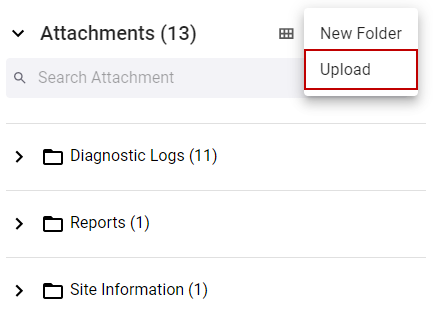
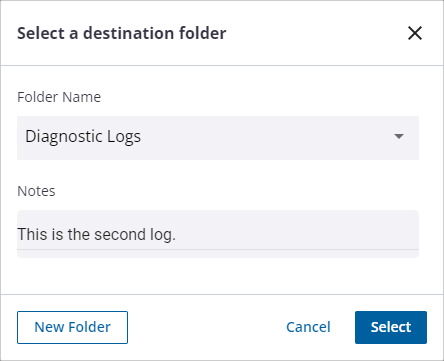
The Select a destination folder panel opens.
- Select the folder from the Folder Name drop-down list to upload the attachment to.
- Enter any Notes about the attachment.
NOTE: You can also add a new folder by clicking New Folder.
When you upload images from a mobile device, they are uploaded to a Default folder.
- Click Select.
- Navigate to the file to upload and click Open.
The file appears in the Attachments section and the folder you selected.
- Click the more options icon and click Rename.
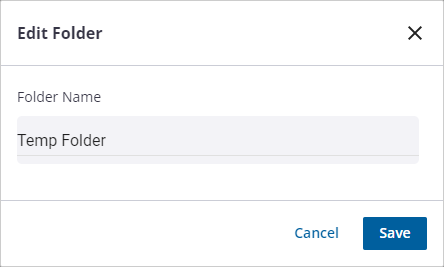
An Edit Folder panel opens.
- Enter the name of the folder and click Save.
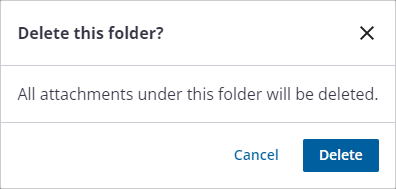
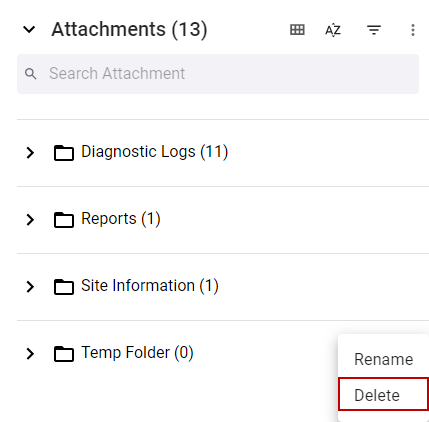
You can only remove folders that you have created. Please note that any attachments within the folder will also be removed.
- Click the more options icon and click Delete.
A panel opens to confirm you want to remove the folder.
- Click Delete.