Analyze Pressure Impulses in Multiple Sites
Unity Remote Monitoring provides the ability to analyze impulses by viewing site details, measurements, and impulse data for individual or multiple sites at a time.
|
|
 PREREQUISITES:
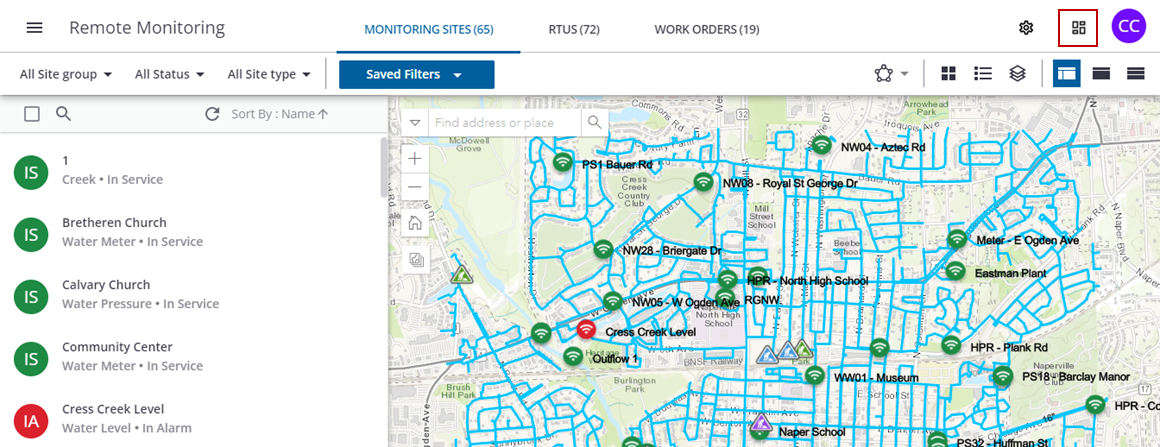
- Click Dashboard in the upper-right corner to open the System Health Dashboard.
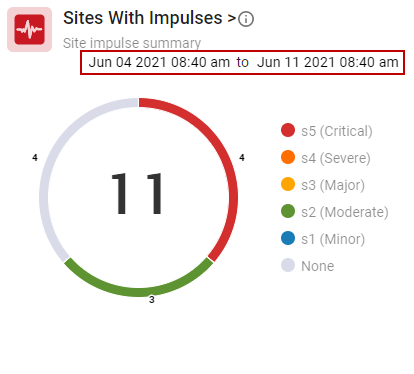
The Sites With Impulses widget shows the total number of sites that are capable of detecting pressure impulses within the past seven days. They are color-coded and categorized by severity. The impulse severity level is calculated based on the pressure deviation during each of the impulse events.
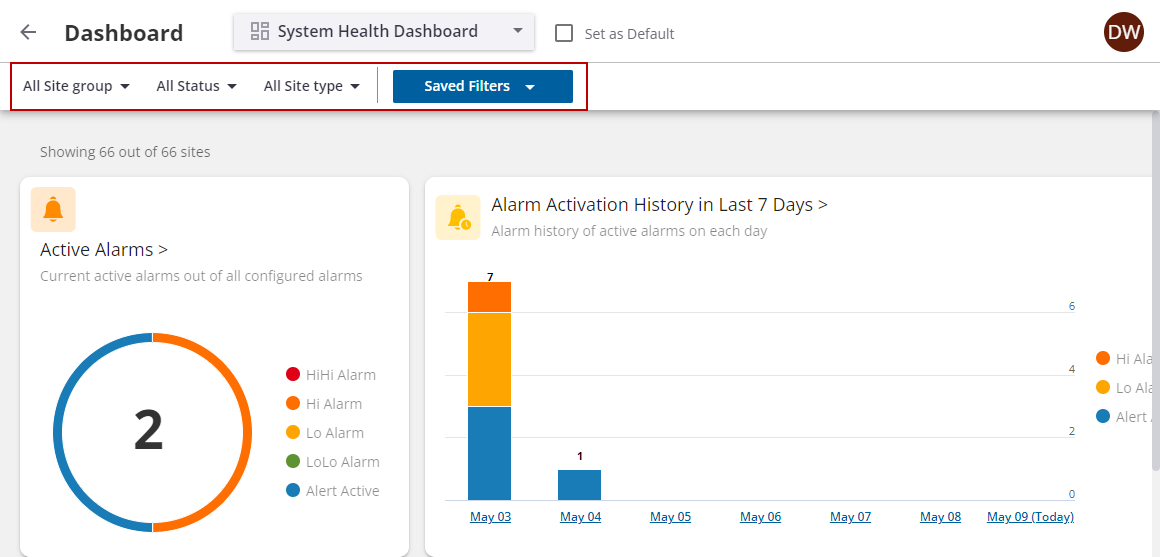
- You can filter the data in the dashboard based on the site group, status, and site type.
- On the Sites With Impulses widget, click the beginning and ending date ranges to filter the impulse summary.
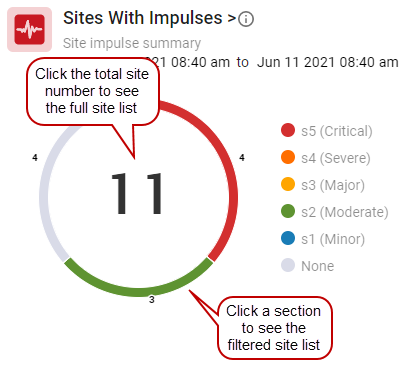
- Click the total site number or the widget title for a full site list, or click a section to see a filtered site list.
The full list of impulses shows the total number of impulses (categorized by severity) for each site. From here you can filter the list of sites by Site group, Status, and Site Type, view the severities at a glance for each site, and open different sites.
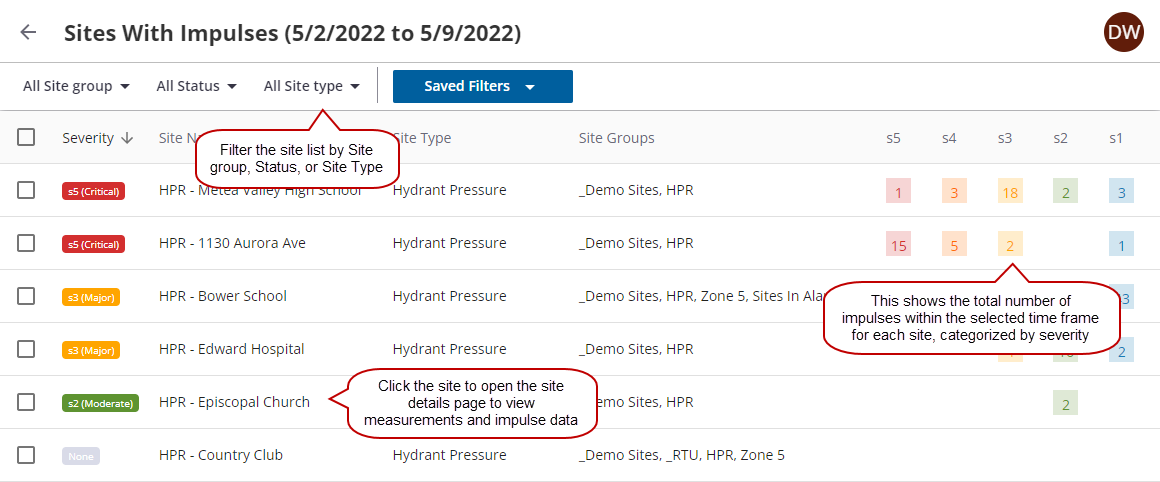
You can select one or multiple sites at a time to view details, measurements, and impulse data.
- Select a site.
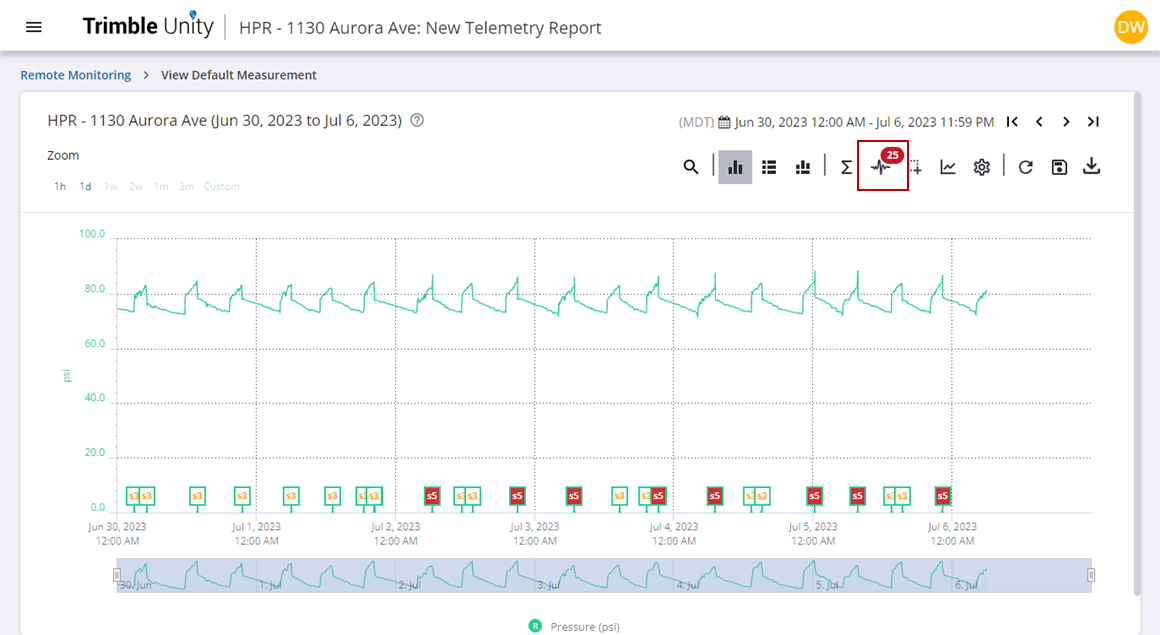
- Click View Default Measurement.
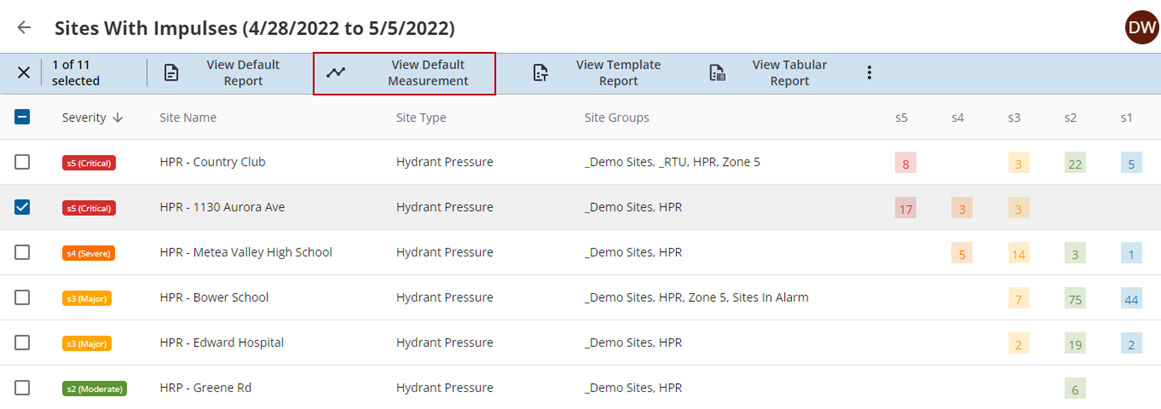
The default impulse data for the site populates.
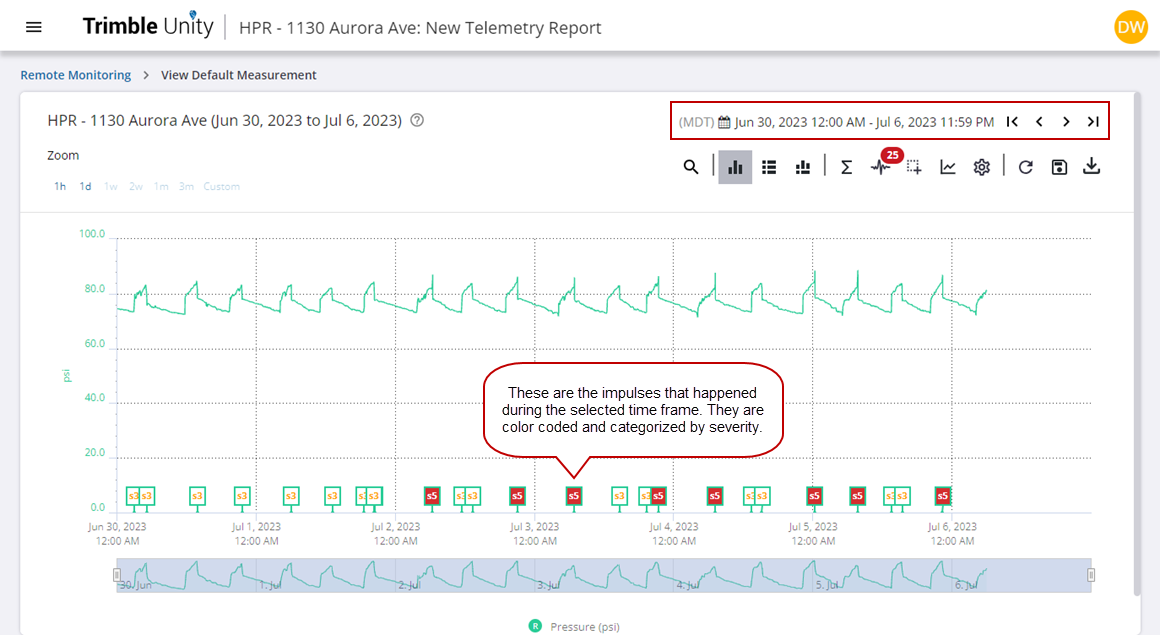
- Hover your mouse over the graph to view data for that point in time.
- Update the date range manually by clicking on the dates and entering the date and time values.
- You can also update the date range by clicking the Start Date and End Date arrows in the upper-right corner to go back in time to the first instance of collected data, or to the most recent instance of collected data.
- To select from a predefined list of time periods, click the more icon and select from the drop-down list.
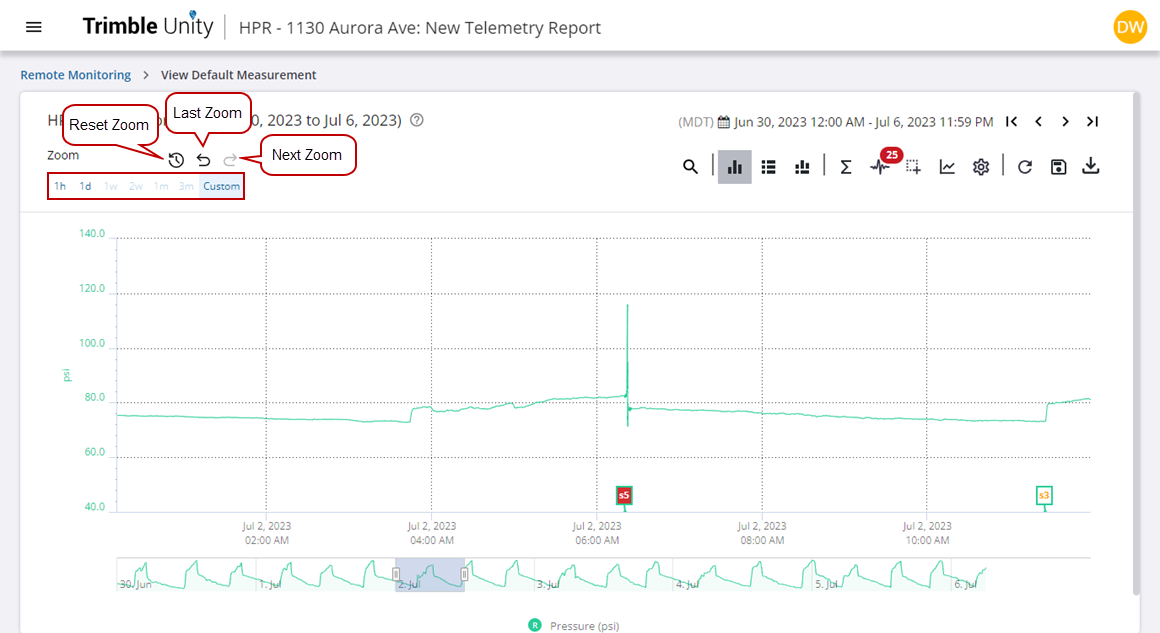
- Click and drag your mouse over the graph to draw a box around the data to zoom to the measurement.
- Click the default zoom ranges above the graph to zoom to 1 hours, 1 day, 1 week, 2 weeks, 1 month, or 3 month time windows. Note that the report will only enable the options that are within the reporting date and time period.
- Click Reset Zoom to reset the graph measurements, Last Zoom to return to the previous measurement zoom, or Next Zoom to return to the new measurement zoom.
- Click a measurement or site name in the legend at the bottom of the graph to quickly show or hide the data for the measurement/site on the graph. This may be helpful if you are viewing multiple measurements/sites at a time and only want to view data for one measurement/site.
- Tap View Impulses to open the Impulses panel. This panel shows all the impulses that happened during the selected time frame.
You will see the following for each impulse in the list:
- The date and time of when the impulse was detected.
- The minimum, average, and maximum pressure of the impulse.
- The recorded duration of the impulse.
- The range of pressure that happened within the selected time period.

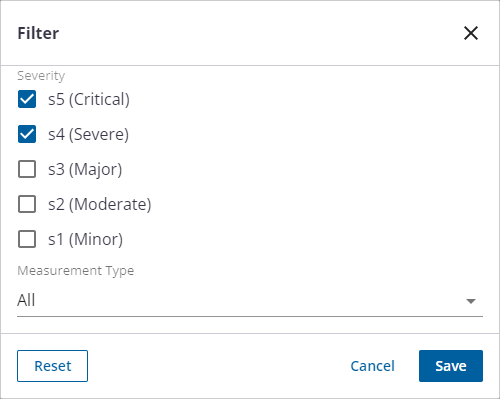
- You can search the list or click the filter icon to filter the list of impulses by severity.

- Click to clear the check boxes of ones you don't want to view and click Save.
- Click Remote Monitoring to return to the list of sites.
