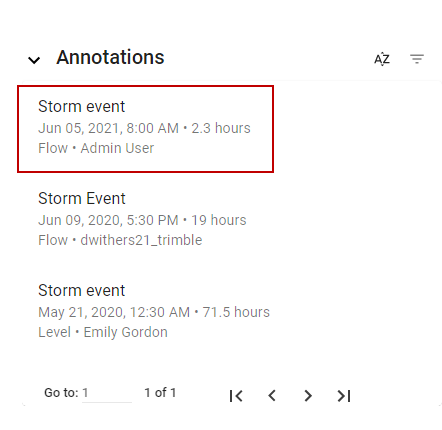
Annotate Measurements
Insights and details with data anomalies can be shared within your organization. Annotations can be created on telemetry data that are associated with particular measurements and time windows to highlight data or operational anomalies.
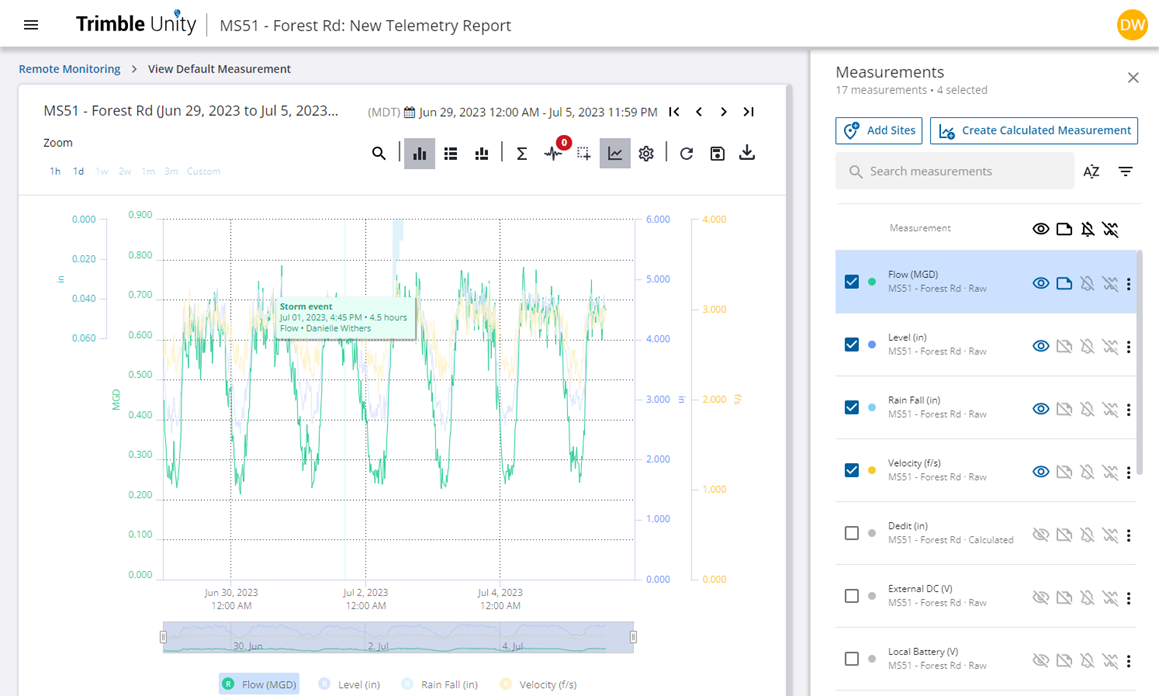
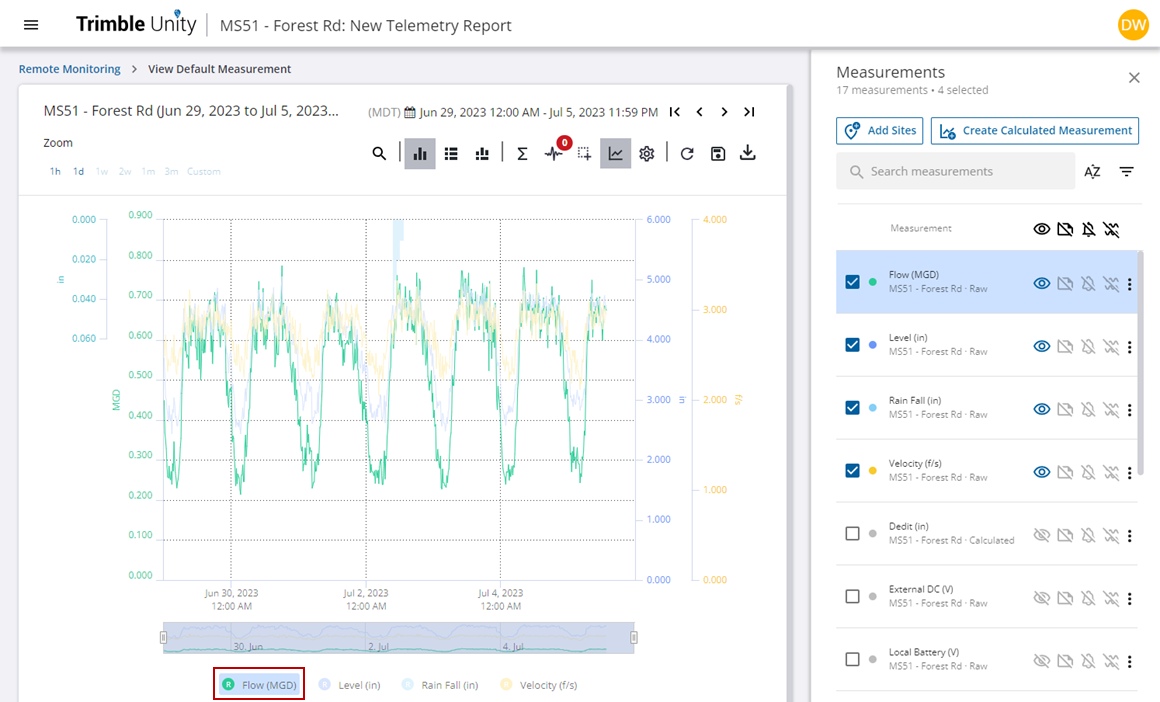
- Open a telemetry report or graph measurements on a report.
- Hold the Shift key and click the measurement you want to highlight.
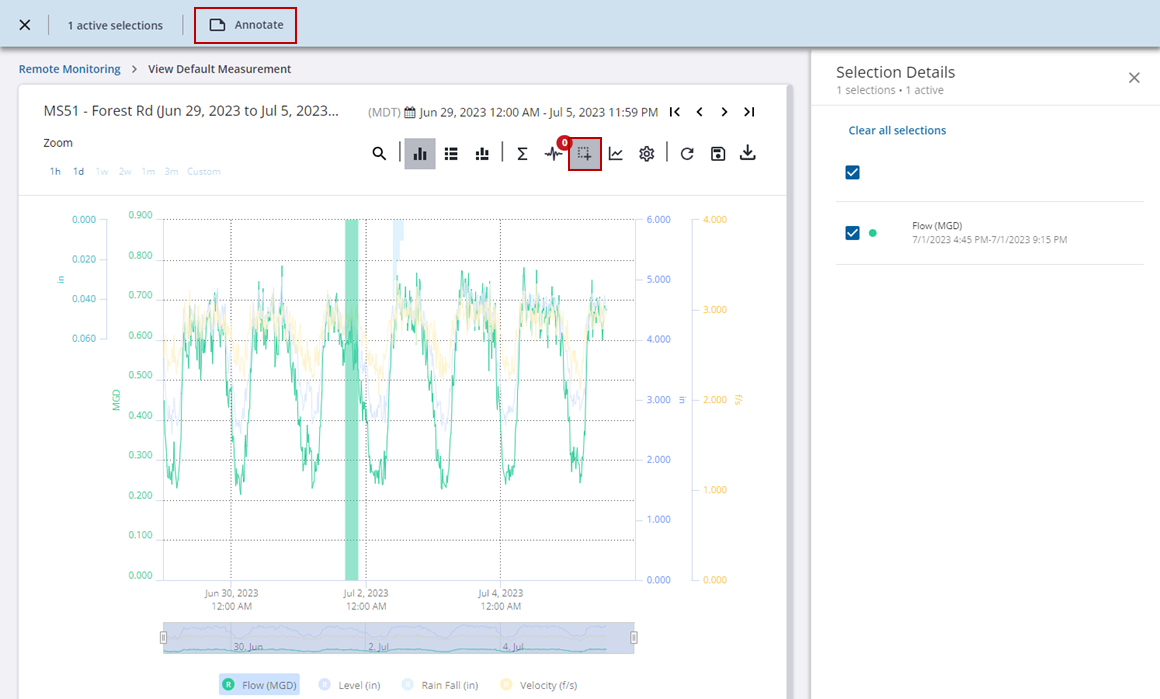
- Press and hold the Shift key and then click and drag on the graph to select a time frame you want to highlight. Repeat this to select multiple time frames, if desired. You can also use Search data to highlight selections on the graph using search criteria. See Search Data for more information.
- Click the View Selections icon to see the selection details.
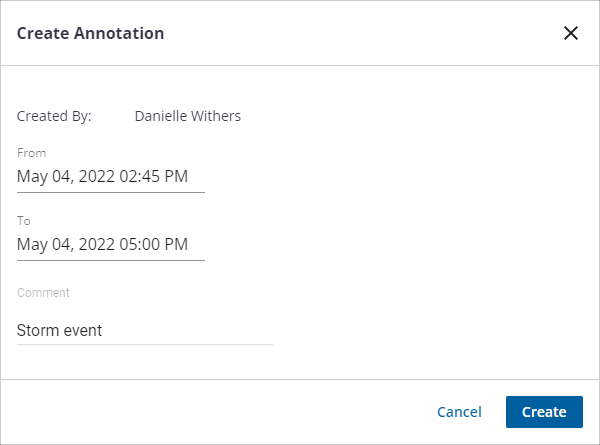
- Click Annotate in the upper-right corner of the screen or right-click the highlighted selection on the graph and click Annotate.
- Enter the comment in the Comment field and click Create.
The new annotation displays on the site details panel as well as on the graph for other members of your organization to see.
- Click the annotation on the site details panel to view the annotation on the graph.