Toggle the Measurement Data Views
Measurement data can be viewed in a chart or table only or in a chart and table together. The different views can be used to compare consecutive measurements as an alternative to using the tooltips within a graph. These views allow you to view the telemetry report data with all enabled measurements on the same page with the graph.
- Open a telemetry report or graph measurements on a report.
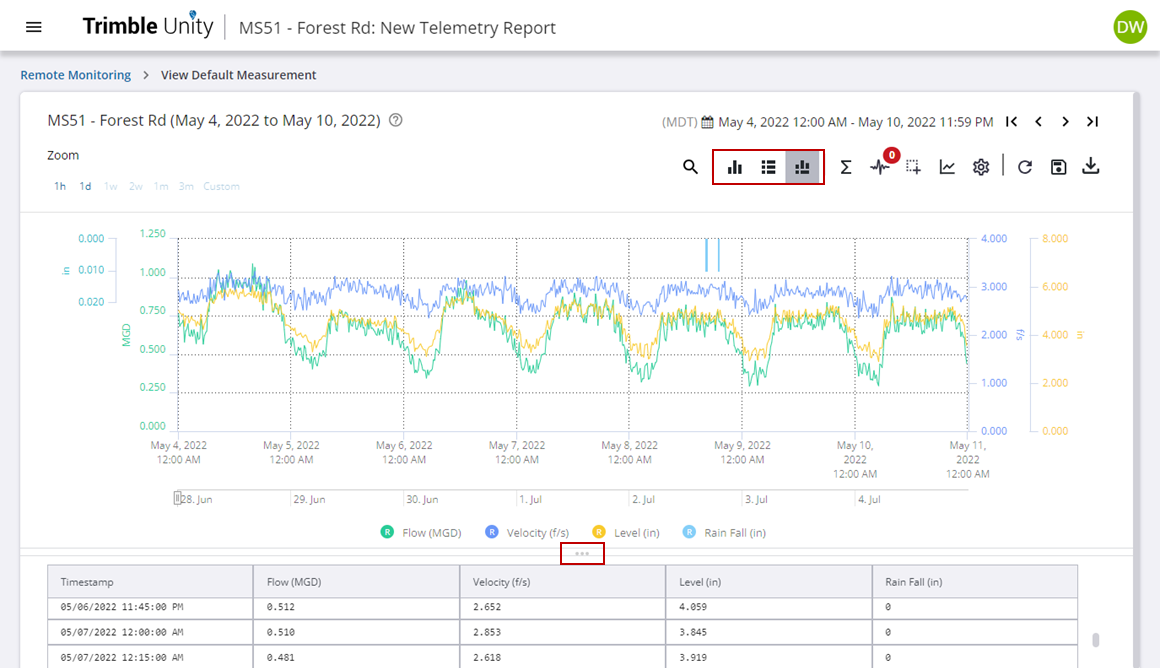
- Click one of the view icons:
- Chart View: View the measurements in a chart only.
- Table View: View the measurements in a table only.
- Chart & Table View: View the measurements in a chart and table.
- If you view the measurements in a chart and table, click the three dots above the table and drag it too adjust the size of the table.
- Click one of the other icons to change the view.