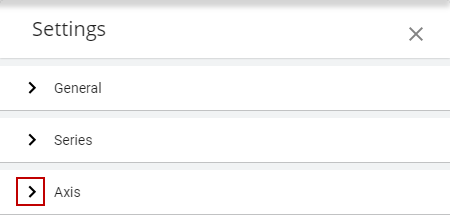
Axis Tab
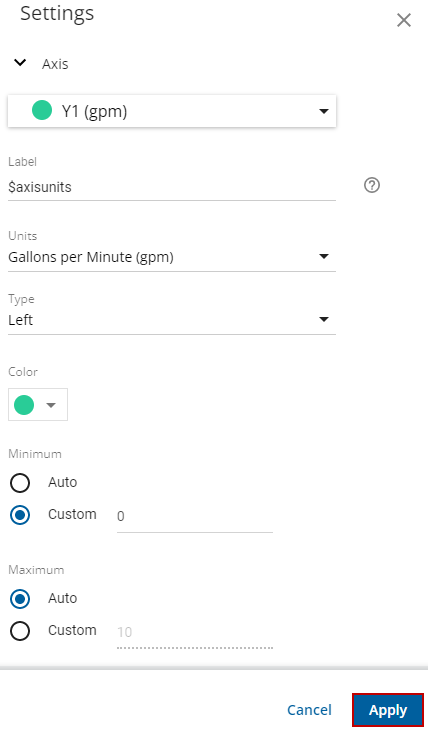
The fields on this tab control the way each axis manages its data display. There is a limit of 5 axes that can be used in Unity RM. Multiple series can share the same axis if they have the same units.
- Click the arrow to expand the Axis tab.
- From the first drop-down list, select the axis to display the corresponding measurements you want to update.
- Click to add or update the Label of the axis.
 TIP: Hover your mouse over the question mark icon to the right of the field for a list of parameters and values.
- Select the Units you want displayed on the axis.
- Select a left or right axis from the Type drop-down list.
- Select the Color of the axis displayed on the report.
- Select Auto or Custom values for the Minimum and Maximum axis values.
- Once all changes or updates are made, click Apply.
The telemetry report will update with the new changes.
The following is a list of the fields displayed in the Axis tab:
|
Field Name |
Description |
|---|---|
|
Axis |
Displays the axis selected for selected measurements. By selecting a different axis, all settings change to match the new axis selection. There is a limit to 5 axis settings that can be used in Unity RM. Multiple series can share the same axis if they have the same units. |
|
Label |
By default, this displays the name of the unit associated with the axis. You can enter your own value if desired. |
|
Units |
Drop-down list of available unit conversions to display for the axis. |
|
Color |
The graph will follow a predefined color scheme by default. In case of multiple series using the same axis the first selected series will designate the color. |
|
Minimum |
Sets minimum scaling range
|
|
Maximum |
Sets maximum scaling range
|